A SAP Business Objects Dashboard Tutorial
Are you an artist? Perhaps a cognitive scientist with expertise in man-machine interfaces?
If you are like me, you are neither of these. However, if you are now in the business of building SAP BusinessObjects based dashboards, which need to convey Performance Information about Key Performance Indicators (KPIs), then you may well be forced to become more artistic and much more aware of and proficient in the art and science of dashboard design.
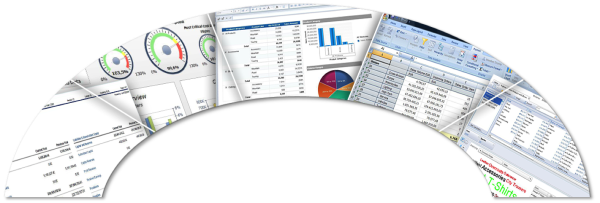
SAP BusinessObjects (BOBJ) Dashboards are actually available from a variety of SAP tools at this point, including xcelsius, Webi, SAP BW, Crystal Reports, Explorer, Analysis.
 SAP Business Objects Tools for Dashboards Come in Many Flavors
Why Testing Is Still Critical

Designing and deploying these dashboards is getting easier, however, to really achieve success, there is one task that has not changed - testing!
Specifically, user acceptance testing of the dashboards is now more critical than ever to achieving buy-in. There are many, many elements to get right including:
- Themes
- Tables
- Graphs
- Navigation
Business Objects Dashboard Design Principles

Remember being an artist I mentioned earlier?
This is where “Themes” come into play with regards to dashboards.
There are many design possibilities with the dashboard tools, and there are countervailing forces within the dashboard design community that argue either for uniformity to make them easier to maintain for the developer or conversely, to allow a lot of freedom with regards to design themes to make the user happy.
My personal opinion falls more toward freedom, but that is because I can and do build my own dashboards.
Simplify to Hit Your Budget
If budgets are tight (and when are they ever not tight?), then simplifying and unifying might work for awhile, but in my experience, anybody with a “C” or “V” in his job title will pretty much get what they want design wise.
Common Design Themes
More importantly, different business areas have what I call ‘natural’ themes they are used to working with.
Finance typically wants detailed information which they then want to dig deeply into.
Production may just want to know how the process is running to be alerted when an anomaly occurs.
Deployment Options
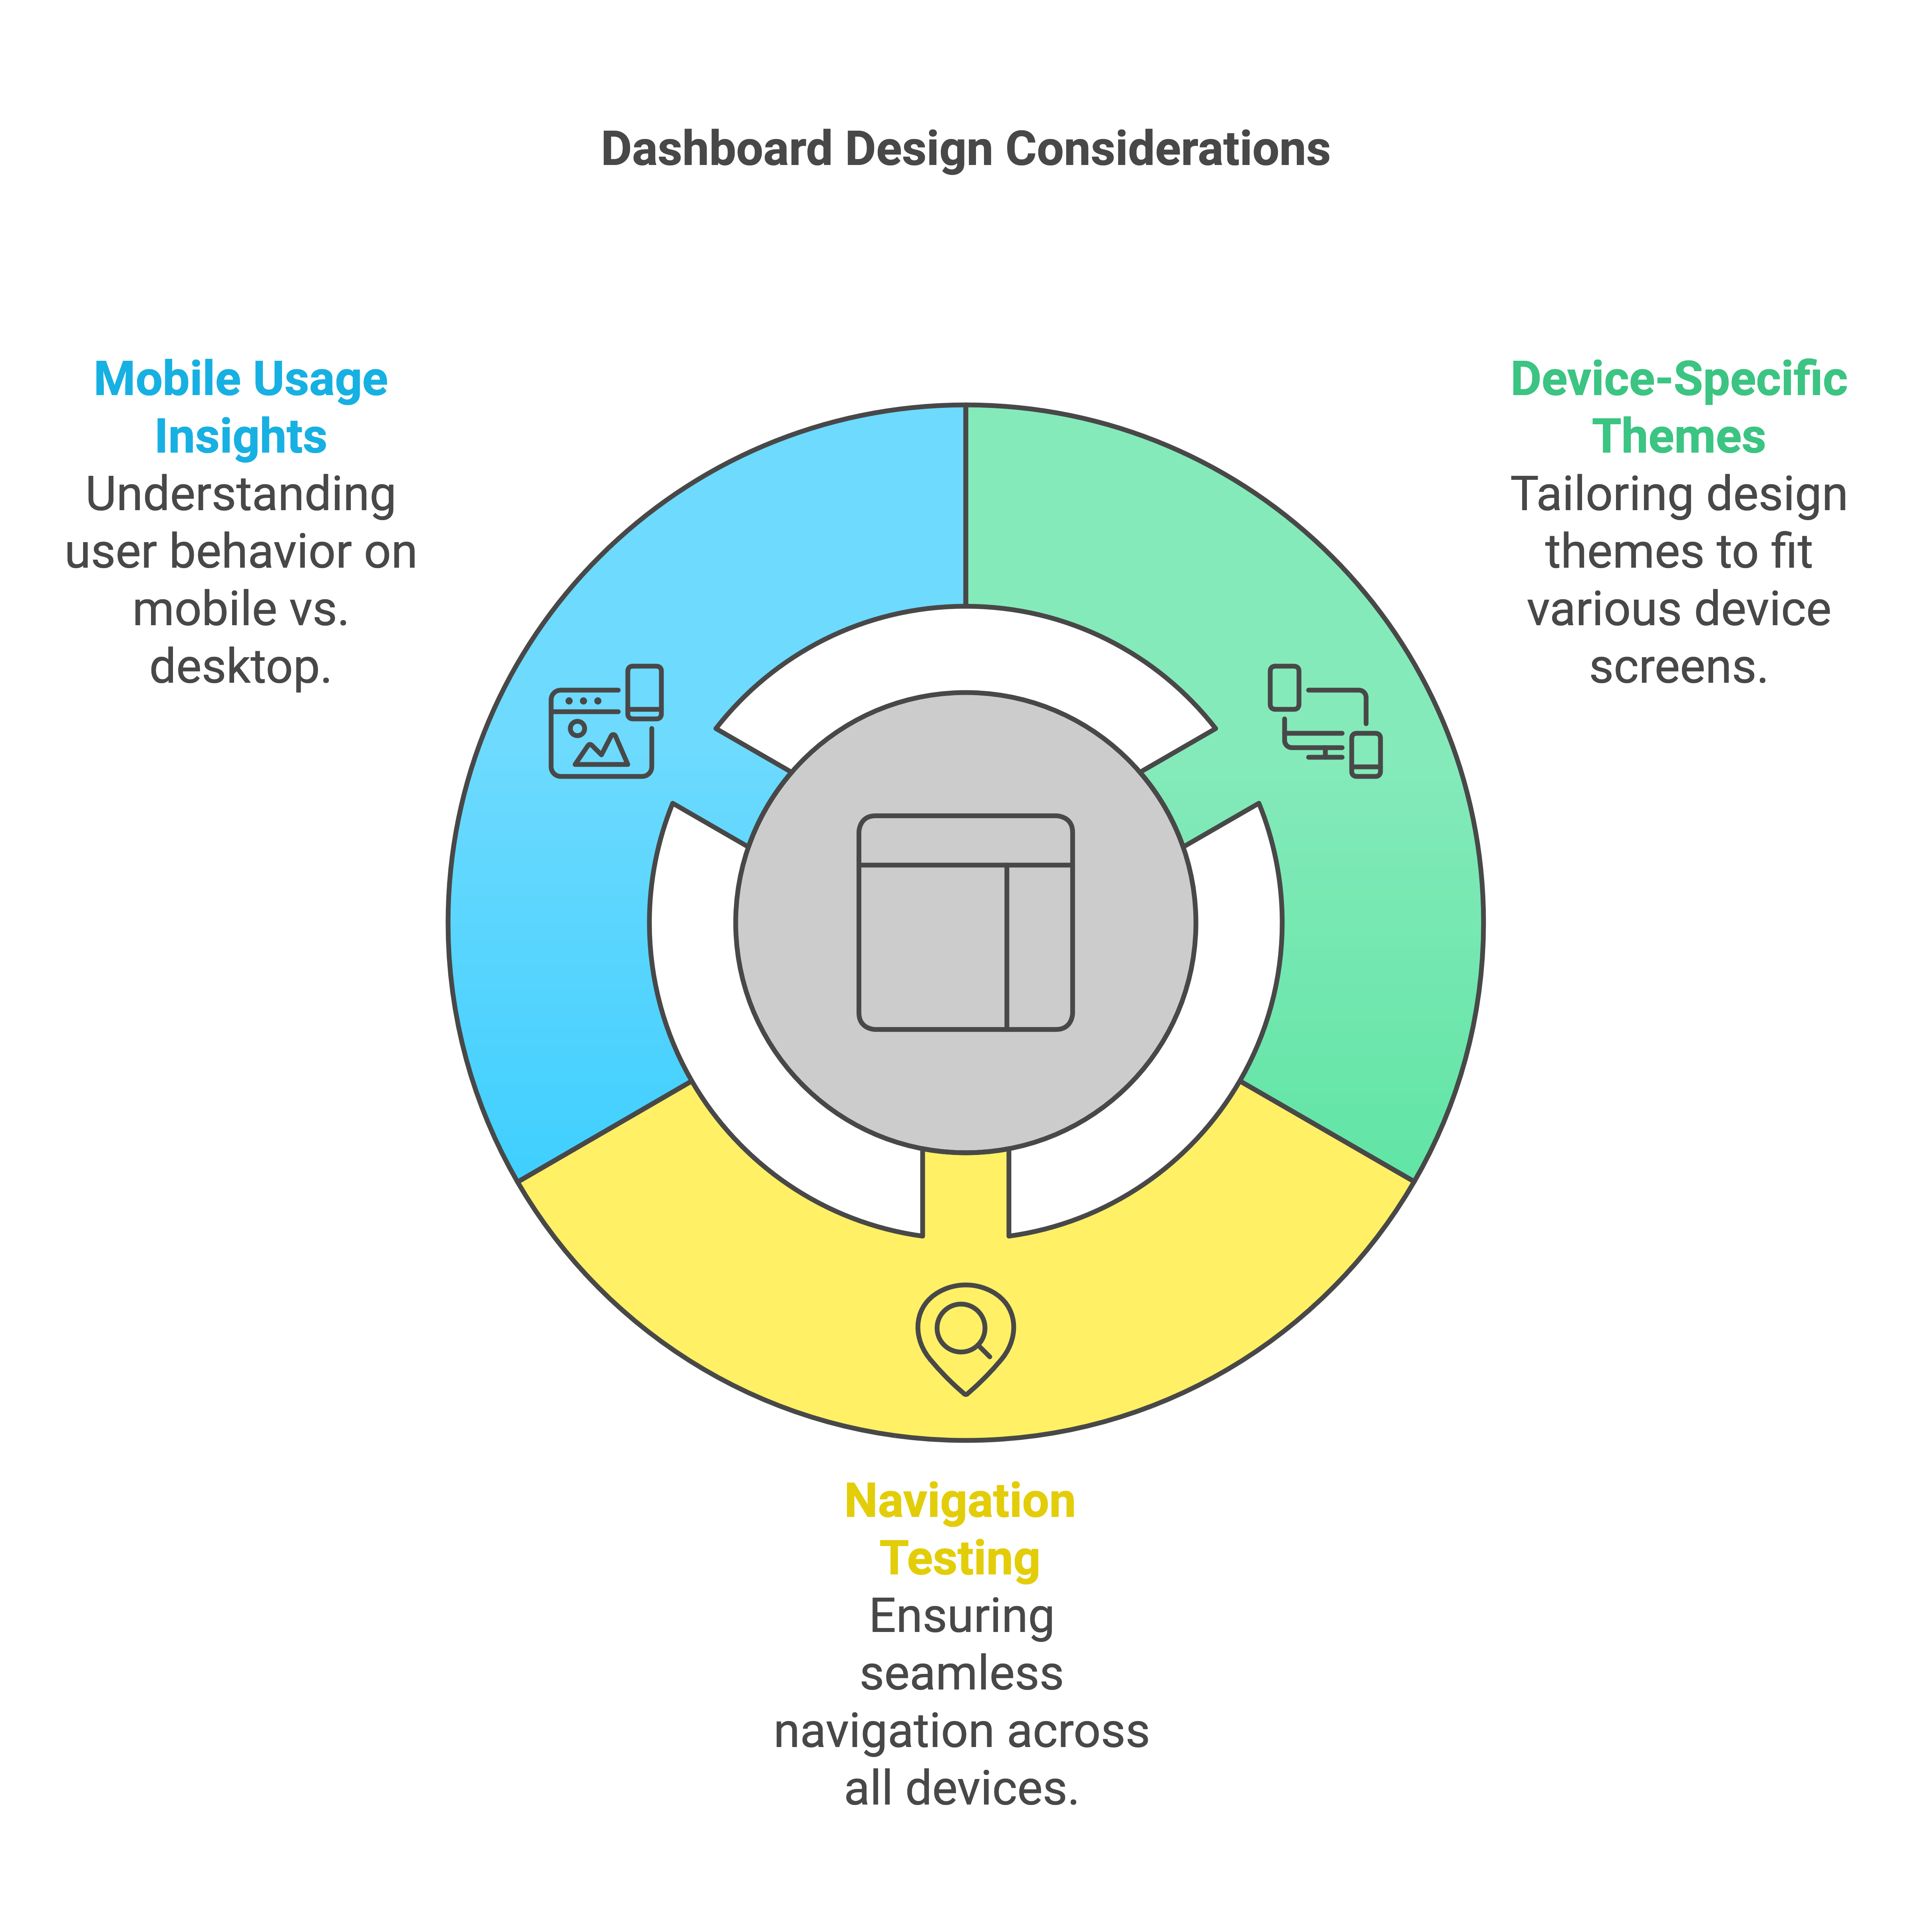
Dashboard deployment also will greatly influence your design themes.
The screen real estate available on a desktop vs iPad vs iPhone is very different, and what you can do, who will use it, and the purpose of the dashboard all will influence your design decisions with regards to themes.
Speaking of screen real estate, Navigation will also be very critical to a successful dashboard project and your testing approach must test this aspect thoroughly, preferably to failure, on every expected type of device.
Did you know that Facebook, in terms of time spent on their site, gets more visits from mobile devices than traditional desktops?
Why mention this?
Users Will Access Your Dashboards Via Mobile
Because your dashboard users will most likely be accessing your dashboards via mobile devices, which have a much more limited navigation capability, so being able to design simplicity in, coupled with effectiveness, becomes a key skill of dashboard designers.
User Age Counts
Another navigation aspect to keep in mind is the expected age (and thus, vision) of your users must be accounted for.
This means larger buttons, shorter drop down list, fewer steps, and highly visible alerting and lower bandwidth availability must all be key design considerations.
You will need to test these elements, not just in your highly wired development center either.
Test it in Real-World Circumstance
If you really want to see a real world example of how difficult this is to get right, watch a work confirmation being done on a mobile device inside a construction zone, such as the Al Khalifa building site in Dubai.
Chose the Type of Graph to Display Carefully

The types of graphs you will use should be driven by the type of data you will be displaying as well as the screen real estate available.
There are lots of handy guides out there on design of graphs, but my advice is to mock them up in excel first, and decide which one you prefer first.
If you have a lot of excel charting experience, you will intuitively know, though it may not be what your user actually wants, so test, test, test to be sure.
Test Performance Across All Dimensions
Finally, performance across all dimensions of your dashboard should be thoroughly tested.
There are numerous performance enhancement techniques, and I will cover those in a subsequent blog.
In the meantime, if you would like a SAP BusinessObjects Dashboard User Acceptance Testing (UAT) form, just click the button below to get a handy one you can modify or use as is.

How are your Dashboard Projects Progressing?
People Who Read This Also Read:
- SAP BusinessObjects BI 4 Advanced Analysis Demo
- How to Get the Webi Universe Data Source Connection Setup
- A Field Report on a recent SAP BOBJ Webi Dashboard Project
- Estimating a SAP BW Project