How To Create xCelsius Dashboards to Leverage External Data
We frequently see a need in the market for companies and government entities to monitor the status and activities of external market players. For instance, an institution such as the Federal Deposit Insurance Corporation, which is the entity that, among other activities, guarantees your savings account in case the bank fails. Unfortunately, in today’s environment, many banks have failed and many more are likely to fail.
A Real World Example
Part of our xcelsius dashboard tutorial series
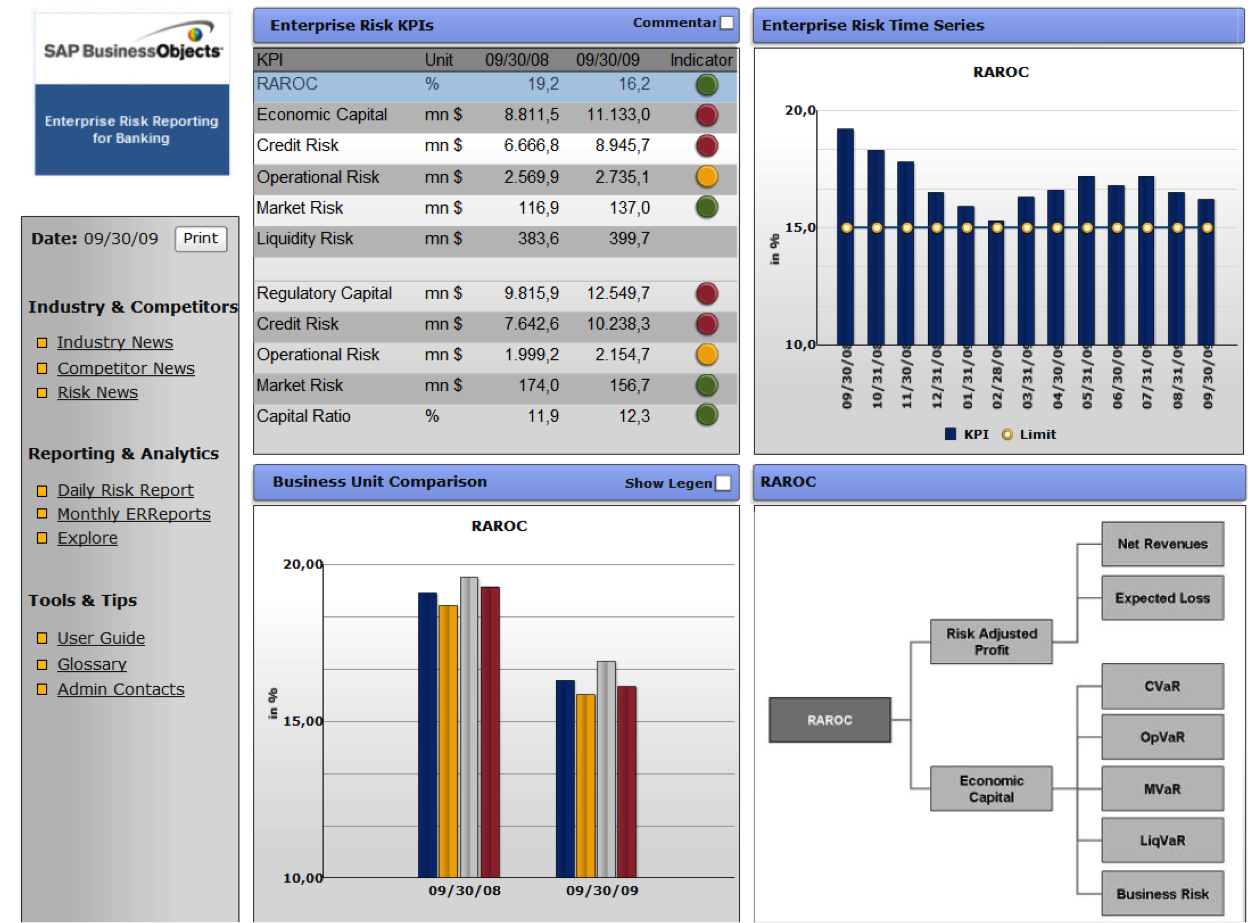
One example Dashboard requirement that might result from this type of oversight activity is to monitor the various aspects of the banks insured by the FDIC.
Just brainstorming here but the characteristics and or design approaches of a dashboard to help in this monitoring would include the following capabilities:
- Ability to monitor the leverage of each bank, down to the branch level, by product. This would be considered a Key Performance Indicator (KPI) that would need to be reflected on the Dashboard.
- Ability to aggregate the overall exposure of the FDIC to potential claims both from individual banks and the overall banking system
- Use of XBRL as a common language across the entities. I remember clearly reading that at the beginning of the 2008 financial crisis, the failure to adopt XBRL by all entities meant it was impossible to easily get the ’info’. This is considered a critical facilitating technology.
- Incorporation of automatic process chains and meta chains, which are programmatic devices to automate the system and to provide automatic alerting when anomalies occur. This is how you enable real-time Performance Indicator monitoring and control systems.
- A common data warehouse, such as SAP BW, which can stand alone without the underlying ERP systems that many banks use, such as the SAP IS-Banking Solution.
- Alerting capabilities-Any dashboard must pro-actively alert the relevant users to pre-planned risk events, i.e. leverage ratios above both the target and the system mean, median and mode.
- Push capabilities for information broadcasting, such that all concerned users can receive it on any device, anytime, anywhere.
- Ability to provide different views of the same data. For example, depositors might want to be able to monitor their own banks leverage and risk levels, but have no need or ability to interpret system wide exposure levels.
- Due to the extremely high data volumes involved in the underlying systems, technologies such as SAP HANA might be a consideration, although not strictly necessary in the initial design stages.
- Be integrated into a larger risk management process.
Though there are doubtless many other aspects of dashboarding to consider when integrating external entities into your project, such as interactive visual analytics design requirements, we have found these to be key in our engineered approach.

Additional SAP xCelsius Dashboard Best Practices
In addition to the design approaches mentioned above, we've also prepared a checklist of xcelsius dashboarding best practices. We suggest you download and print it out, hang on your project teams wall, and refer to it frequently as you build SAP Dashboards.
People Who Read This Also Read:
- 10 Critical Chain Project Manager Tips
- How To Use Google Keyword Planner Tool Tutorial
- Top 10 Benefits for Financial Analysis in the Latest SAP EP4
- Learn What Tools To Use To Investigate IS-Mill Functionality
- BusinessObjects Explorer Best Practices
- Take a Deeper Dive into Aircraft Cockpits Vs Dashboards
About SAP BW Consulting, Inc.
SAP BW Consulting, Inc. provides comprehensive SAP solutions, including SAP Business Intelligence (BI) and SAP Business Warehouse (BW) consulting, SAP ABAP development, and project management. Our services also include a 1099 Contractor Invoicing and Payment Management System, Salesforce consulting, and Balanced Scorecard consulting for strategic planning. As HubSpot Marketing and Sales Partners, we specialize in Google Ads, Facebook Ads, LinkedIn Ads, Account-Based Marketing, Content Marketing, and Ecommerce solutions, including Shopify.
Ready to optimize your operations and strategy? Book a meeting with us.


