Balanced Scorecard Financial Perspective
When developing your Balanced Scorecard Strategy Map, improving shareholder value will likely be at the very top of your Financial Perspective as a key objective. Improving ROCE (a key profitability ratio) is often part of achieving that objective. But how do you calculate it?

Return on Capital Employed Explained
Return on Capital Employed (ROCE) is a key financial metric that measures a company's profitability and the efficiency with which it uses its capital. It is often used to compare the performance of companies in capital-intensive industries. ROCE can be determined directly from a company's financial statements, particularly the balance sheet and income statement.
Formula for Return on Capital Employed - ROCE:

How Do You Calculate Capital Employed?
ROCE can be calculated using the following formula:
ROCE = Operating Profit (EBIT)/Capital Employed
Step-by-Step Calculation:
-
Operating Profit (EBIT):
- This is the Earnings Before Interest and Taxes (EBIT).
- You can find EBIT on the income statement, usually referred to as "Operating Profit" or "Operating Income."
- If it's not directly listed, you can calculate EBIT as: EBIT = Revenue - Operating Expenses (excluding interest and tax expenses).
-
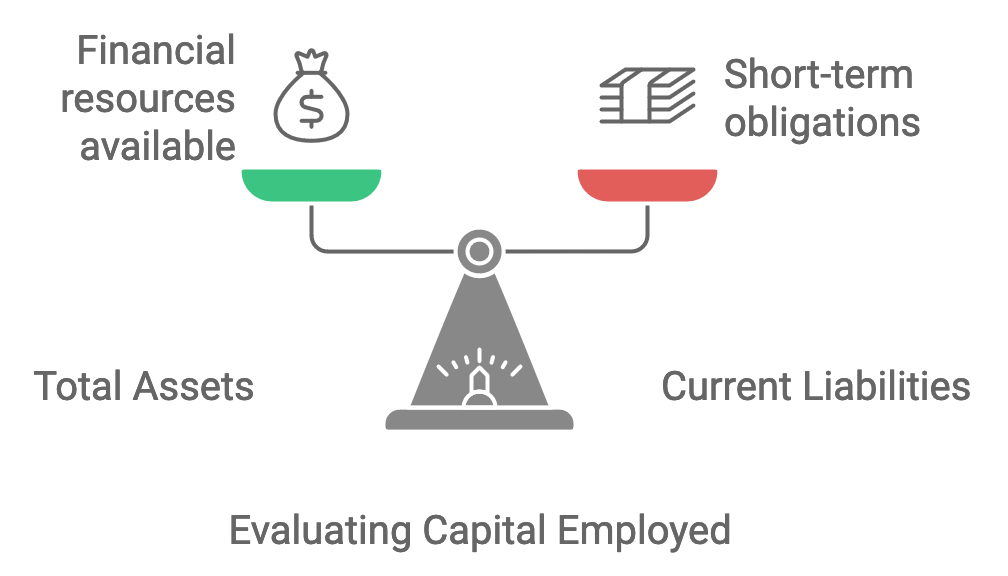
Capital Employed:
- Capital Employed is the total capital used for the acquisition of profits in the company and is calculated as:
Capital Employed= Total Assets - Current Liabilities. - Alternatively, it can also be calculated as:
Capital Employed = Equity + Non-Current Liabilities. - You can find Total Assets and Current Liabilities on the balance sheet.
- Capital Employed is the total capital used for the acquisition of profits in the company and is calculated as:
Example:
How do you find the return on capital employed using this process? Let’s assume a company has the following data from its financial statements:
- Operating Profit (EBIT): $500,000
- Total Assets: $3,000,000
- Current Liabilities: $1,000,000
Capital Employed would be calculated as:
Capital Employed = $3,000,000 - $1,000,000 = $2,000,000
Then, ROCE would be:
ROCE = $500,000/$2,000,000 = 0.25 or 25%
Interpretation:
- A ROCE of 25% means that for every dollar of capital employed, the company generates 25 cents in operating profit.
- A higher ROCE indicates better performance, suggesting that the company is efficiently generating profits from its capital.

Key Considerations:
- Industry Comparisons: ROCE is best used to compare companies within the same industry.
- Capital-Intensive Businesses: ROCE is particularly useful for evaluating companies in capital-intensive industries, such as manufacturing, utilities, and telecommunications. These companies typically have large amounts of capital tied up in assets, and ROCE helps assess how effectively they are using that capital to generate profits.
- ROE: ROCE may be a better financial metric to focus on than return on equity (ROE), which looks at profitability relative only to shareholder equity and does not account for the significant debt that such companies tend to have.
Interpretation of Return on Capital Employed
The return on capital employed shows how much operating income is generated for each dollar of capital invested.A higher ROCE is always more favorable, as it indicates that more profits are generated per dollar of capital employed.
Limitations of ROCE:
- Ignoring Interest and Taxes: Since ROCE uses EBIT, it doesn’t account for the impact of interest and taxes, which can be significant in highly leveraged companies.
- Static Measure: ROCE is a snapshot at a specific point in time and doesn’t account for changes in capital employed or profitability over time.
- Different Accounting Policies: Variations in accounting policies (e.g., depreciation methods) can affect ROCE and make comparisons between companies less meaningful.
Enhancing ROCE Analysis:
- Trend Analysis: Evaluate ROCE over several years to understand trends and consistency in capital efficiency.
- Compare with Cost of Capital: Compare ROCE with the company’s cost of capital (WACC) to determine if the company is generating sufficient returns relative to what it costs to finance its operations.
Invested Capital.
- ROIC: Go beyond ROCE and look at other financial ratios, such as Return on Invested Capital.
- Capital Invested: ROIC represents the percentage return earned by a company, accounting for the amount of capital iinvested by equity and debt providers
By understanding and calculating ROCE, you can gain insights into how well a company is using its capital to generate profits, making it a valuable tool for investment analysis and financial management.
Hopefully, this consolidated explanation provides a clear overview of how to calculate and interpret ROCE from financial statements.
Working on Your Strategy Map?
For those working on developing your Strategy Map in support of your overall Balanced Scorecard, improving ROCE is often a top level Financial Perspective. If you're about ready to to start your Balanced Scorecard initiative, that's where we come in. Please use the button to request Balanced Scorecard Consulting Services.
About SAP BW Consulting, Inc.
SAP BW Consulting, Inc. offers specialized SAP Business Intelligence solutions, focusing on SAP Business Warehouse (SAP BW) consulting and implementation support. With expertise across all 16 core SAP modules and 31 industry solutions, we provide comprehensive SAP services, including ABAP development and project management, ensuring your business operations run smoothly.
Beyond SAP, we are certified HubSpot Marketing and Sales Partners, helping businesses drive growth through the HubSpot Inbound Methodology. We also offer Salesforce consulting to optimize complex environments that integrate SAP, HubSpot, and Salesforce.
Balanced Scorecard Consulting
In addition, we provide Balanced Scorecard consulting, helping companies design and implement effective strategies to improve performance and achieve long-term success.
If you're ready to elevate your SAP operations, marketing, or strategy, book a meeting with us today.