SAP Web Intelligence is a tool for analyzing your organization's business information
With SAP BI Web Intelligence or Webi powered by SAP HANA, you can query your organization's databases using your everyday business terms using an easy-to-use interface. You can create simple or very complex reports using big data sources, and share the information you display with colleagues throughout your enterprise.
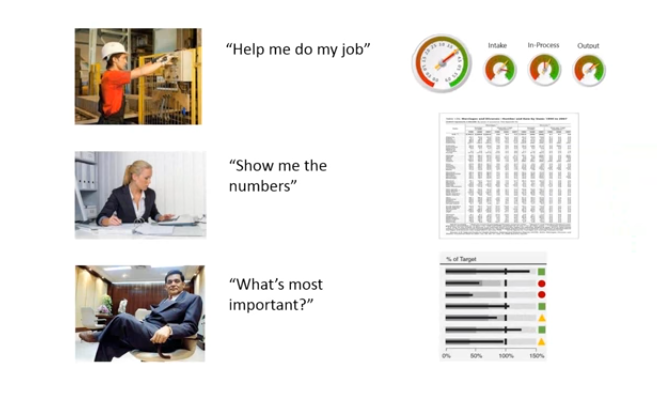
Getting the right information to make decisions
SAP Webi is designed to provide you and your colleagues quick, easy access to useful information. As part of your job typically involves making data based decisions, you need the right information available at your fingertips to help you make the right decisions.
Webi Intelligence allows you to access, analyze, and share corporate data over both intranets and extranets. It can read data from both relational databases (RDMS) and online analytical processing (OLAP) servers.
You use or access SAP Webi using BusinessObjects portal InfoViews within your internet browser. You also use the mechanism to share documents with others.
Web Intelligence can also be used in offline mode using the Web Intelligence Rich Client, a standalone Microsoft Windows application you must be installed locally on your PC. When working in offline mode using the Rich Client, you can continue to work with Web Intelligence Documents (WIDs).
You also use the Webi Rich Client while connected to the Business Objects CMS or Central Management Server repository.
BusinessObjects Universe - A Key Concept
SAP Webi needs data in order to display it in a meaningful format to your users. It uses a concept called Universes, which can represent data from business areas such as Finance, Sales, Human Resources, Purchasing, Equipment Maintenance, Project Systems and many others.
Universes are normally created by a universe designer who is deeply knowledgeable of your organization's databases. Using the BusinessObjects Designer, the Universe Designer will create universes and make them available to users as InfoViews, normally within the BusinessObjects portal. When you want to create a Web Intelligence document, you first select a query that interests you.

Creating Webi Documents With Queries
In order to retrieve new data from your corporate data sources using Webi, you will need to create Web Intelligence documents or edit the query associated with an existing document.
In order to create a new document, you do the following:
- Chose an appropriate data source
- Use the Web Intelligence Query designer panel to create a query that will determine which data is being extracted from the database.
Using one of the Web Intelligence query panels, you formulate your business question or query, that will be used to retrieve the information you need.
Once that is done, the query is sent to the Webi Server. The Webi Server then retrieves the data from the target database and stores in a microcube. The contents of this microtube are then formatted and displayed in a Web Intelligence report which can take the form of tables, cross-tab reports and interactive charts for your analysis.
Universes and Objects
One of the key strengths of SAP Webi is that enables you to work with familiar business terms versus more technical SQL (Structured Query Language) code used to retrieve data from your database.
It Uses Semantic Layers To Do This
Using what is known as a semantic layer, it provides a sort of Rosetta stone that translates your business terminology to database terminology.
Drag and Drop Design
Like most modern tools, it uses the familiar drop-and-drop technology to select, drag and drop objects to graphically create your queries. These objects, part of the universe, are used to group data into classes, which then are mapped into the Universe Schema, which then allows your system to retrieve data from your database.
Three Types of Objects
- Dimensions - Used to retrieve the data that provides the basis for analysis in a report. Dimension Objects typically retrieve character-type data, i.e., Customer Names, Store Names, Dates, Product Names.
- Details - Descriptive data about a dimension. Detail data is always specific to the dimension for which it provides additional information.
Examples of detail data could include: Age and Address for the Customer Dimension. - Measure - Numeric data that is the result of calculations done on data in your database.
Examples of measure data include: Revenue is the calculation of the number of items sold multiplied by the item price. Measure Objects are very often located within a Measure Class.
Universes Can Also Include Pre-Defined Query Filters
- Query Filter is used to restrict the information returned by objects.
Examples include: Limiting the data concerning revenue to a specific year. - Filters can also be used to provide a better user experience.
For instance, filters can be used to prompt a user to select a value, such as 'Which Product'

Restricting Data Returned by a Query
Use Query Filters to Restrict the Amount of Data Retrieved
Many datasets are far too big to be useful for analytical purposes. In order to restrict the amount of data you get when running a query, you use query filters. For example, if you want only to see this data for this year, versus all years, you apply a filter for the current year.
Query Filters Provide the Following Advantages
- You are able to retrieve and focus on only the data you are interested in.
- You can hide data you do not want certain users to see when they access your document
- You can optimize the performance of the system by limiting the data retrieved to only what you are interested in.
| Operator | Retrieves Data | Example |
| Equal to | equal to a value specified | [Country] Equal to Japan retrieves data for Japan country value only |
| Different from | different from a specified value | [Quarter] Different from Q4 retrieves data for all quarters except Q4 |
| Greater than | greater than a specified value | [Machine Age] Greater than 10 retrieves data for machine ages over 10 |
| Greater than or equal to | greater than or equal to a specified value | [Revenue] Greater than or equal to $100,000 retrieves data for revenue starting from $1000,000 and up. |
| Less than | lower than the specified value | [Flight Test Grade] Less than 95 retrieves data for Flight Test Grades less than 95 |
| Less than or equal to | lower or equal to specified value | [Customer Age] Less than or equal to 29 retrieves data for customers age 29 or less |
| Between | between two specified values; also includes value specified | [Weeks] Between 30 and 36 retrieves data for weeks 30 to 36, including week 30 and 36 |
| Not Between | outside the range of the values specified | [Weeks] Not Between 30 and 36 retrieves data from weeks of the year excluding week 30 through week 36. Week 30 and 36 are not included. |
| In List | same as values specified | [Country] In list 'US;Japan;UK' retrieves data for countries US, Japan and UK. |
| Not in List | different from multiple values specified | [Country] Not in List 'US;Japan;UK' retrieves data for all countries except US, Japan and the UK. |
| Is null | for which there is no value entered in the database | [Children] Is Null retrieves data for customers without children where Null is entered as a value for the database under the children column |
| Is not null | for which a value was entered in the database | [Children] Is not null retrieves data for customers with children where any value is entered into the database under the children column |
| Webi Matches Pattern | including a specific string |
[Phone] Webi Matches Pattern, '812' retrieves data for all phone numbers that have '812' in them. [Festivals] Webi Matches Pattern %SWX retrieves data for a festivals ending in SWX |
| Different from pattern | doesn't include a specific string |
[Phone] Different from Pattern '812' retrieves all phone numbers that do not have '812' in them. [Festivals] Different From Pattern %SWX retrieves data for all festivals not ending in SWX. |
| Both | corresponds to two specified values | [Account Type] Both *fixed* and *mobile* retrieves data for customers who have both a fixed and mobile phone. |
| Except | corresponds to one specified value and does not correspond to another specified value | [Account Type] *fixed* Except *mobile* retrieves data for customers who have a fixed telephone but don't have a mobile phone. |
Addition Query Information
You can pre-define queries with predefined query filters, which, in effect, is a a filter of a filter. There are also both Single-Value filters as well as complex filters using logical operators for multiple conditions, using operators such as AND and OR as well as others.

Designing Web Intelligence Reports
Components of a Web Intelligence Document
A Web Intelligence Document can consist of one or more of the following components:
- One or More Reports
- Each Webi Document can contain several reports, organized into convenient tabs. Each report within the tabbed report structure can contain blocks of highly formatted text and graphics.
- Each Report Can Contain One or More Blocks
- A block is a table, cross-tab, form, or chart that displays information within the report
- Microcube
- A microcube contains a subset of data that was retrieved from your corporate database. Data is stored within the document within a microcube structure. It contains all the data you can display inside a report(s) inside the document.
Web Intelligence Rich Client is Your Primary Report Development Tool
As the name implies, the Rich Client provides a full suite of report development capabilities. With you, can create tabbed reports and variety of graphics, both static and interactive. It allows you to prepare drill-down reports. You can also segment your reports and add more contextually relevant information by inserting free-standing cells and by using other segmentation techniques.

Enhancing the Presentation of Reports
Enhance Your Reports With Breaks and Calculations
Breaks allow business users to structure long tables of data into smaller, more digestible chunks of information, such as in units of time:
- Years
- Quarters
- Months
- Days
- Hours
Calculations allow you to summarize large volumes of data, such as Sales Transaction data, to uncover the totals, trends and meanings.
Other Useful Ways to Enhance a Report
- Sorts
- Smallest to Largest
- Largest to Smallest
- Newest to Oldest
- Oldest to Newest
- Alphabetical
- Report Filters
- Use to Restrict the Data Shown
- Use Constants and Variable
- Ranking
- Top
- Bottom
- Tracking Data Changes
- Activate Data Tracking
- Set Reference Data
- Format Data Changes to Draw Attention
- Types of Data Changes to Track
- Added Data
- Removed Data
- Modified Data
- Increased Data Values
- Decreased Data Value
- Use Alerts
- Contains Five Elements
- Name
- Object or Cell Contents
- Operator
- Operand value(s) or another object
- Conditional Formatting
- Contains Five Elements

Formatting Reports
Properties Manager
In order to format a report in Web Intelligence, you use the properties manager, which allows you to format all elements in a document.
You can format:
- Table Properties
- Cell Properties
- Section Properties
- Chart Properties
You can also format a report for PDF output or printing. In addition, you can format documents for improved mobile device viewing.

Creating Business Objects Formulas Examples
Formulas Reveal Hidden Information
Some Business Objects Examples
By designing and using formulas, you can display information that you cannot retrieve by using the existing database objects in the universe.
Formulas can consist of data objects, functions, operators and calculation contexts and Business Objects date formulas. Although you can create formulas directly in a report cell, it is usually better to save a formula as a variable. This provides for a higher degree of reuse across all reports.
There are two ways to build a formula:
- Type or drag and drop the formula components into the Formula toolbar.
- Use the Formula Editor to build the formula
Saving Formulas as Variables
What is a variable and how do you use in the context of formulas? A variable is a formula you save with a name and, based on the formula, a qualification is assigned to it. It then is shown in the Report Manager and is available like any other object.

Using Multiple Data Sources
Multiple Universes Equal Greater Capability
SAP BusinessObjects Webi allows you to combine data from different Universes into a single document. Each of these can have a different data structure. You can combine one or more queries in an InfoView in a single Web Intelligence document.
Real Power To Enhance Data
By combining data within your corporate business intelligence data warehouse and other databases with data from 3rd parties or from your own sources, you can significantly enhance the utility of your data.
Use Blocks and Synchronization
By combining multiple Universes into different blocks and using data synchronization, you can merge data into one common dimension. You can also use a single query to project data in multiple blocks. By combining two queries, you can project into multiple blocks as well. It also possible to merge dimensions into a single block which then needs to be synchronized in order to be used successfully in a report.
Rules for Merging Dimensions
- You can only link on dimension objects, Aircraft Name and Type
- Dimension objects do not have to have the same names
- Dimension objects must have a common data format.
- Data held in a data provider is case sensitive. Common values must be in the same case.
- Format values must be the same.
- Unlimited number of queries can be linked by common dimension objects.
- Any number of of dimension objects can be merged between two queries.
- A measure object can only be synchronized at the lowest level of detail that is common between two different data sources.

Analyzing Data
Drilled Down Into High Level Summarized Data
It's a virtual certainty that high-level summarized data will need to explored by drilling down into it on ad hoc basis. You do this identify both the trends and reasons for what you're seeing. In order for you to be able to drill down on a web intelligence document, drill mode has to be enabled.
Scope of Analysis
What is meant by 'Scope of Analysis'? Scope of Analysis for a query is extra data you can retrieve from the database to provide more details about the data returned by each of the objects in a query. This extra data does not appear in your initial document results, but it is and remains available in the the data provider. You can drill down into the report at any time (providing drill mode is enabled) and retrieve additional richer details about the objects you are analyzing. Within BusinessObjects Universes, the scope of analysis corresponds to the hierarchical levels below the object selected for a query.
You can establish the scope of analysis level when you build a query. When you do this, it allows objects lower down the hierarchy to be included in the query. They will initially not appear in the Results Objects, even though they are available to the user.
Standard Drill Down vs Query Drill Mode
Query Drill Mode behaves differently than standard drill down mode. You use query drill when a report contains aggregate measures calculated at the database level. In this way, it leverages the database capabilities for greater performance and at the same time, provides for queries that Web Intelligence does not support at the drill down session.
Aggregate Function Candidates for Query Drill Down Mode
- Percentages
- Distinct Count
- Ranks
- Standard Deviation and Variances
- Running Aggregates
- Lead and Lag Functions
Drill Down Mode Improves Performance
Query drill down is also very useful for reducing the amount of data that Web Intelligence must store locally during a drill session. It does this by reducing the scope of analysis when you drill up and by purging unnecessary data. Many aggregate business objects functions also cannot be accurately performed by Web Intelligence in it is therefore better to use the database capability.

Managing and Sharing Web Intelligence Documents
Sharing Using InfoView
In order to share a Webi Document you have created with the Web Intelligence Rich Client, you must first export to the CMS or Central Management Server.
The CMS allows you to create complex folder structures to store and share your documents. Folders can be public or private and can use categories for further eas of use. You can export a document to the CMS with or without saving it locally.
Categories are:
- Used to tag documents in a meaningful way to classify them for organization purposes
- Used to allow users to view documents across the system because a category is not constrained by the document's storage location.
- Can be Corporate (Corporate Categories) or Person (Personal Categories)
You can share Webi documents with InfoView users by sending documents directly to their InfoView Inbox folder. You can also just save a document as a public document in your corporate repository if you're authorized. If someone you want to share a report with is not an InfoView user, you can still share them via Excel or Adobe PDF us Acrobat Reader. In addition, you can 'schedule' a document to run on a fixed time basis. This might be useful for example, to see weekly sales reports.
Different Web Intelligence Report Panels
Web Intelligence has at least four different interfaces that Report Designers can use to create queries and reports:
- Java Report Panel
- Web Intelligence Rich Client
- Interactive HTML
- Web Accessibility HTML
Critical Success Factors
Successful Webi Projects need, like all reporting projects:
- A single Business Stakeholder to articulate all of the business requirements but in all likelihood, there will be many interested stakeholders.
- To have all reporting requirements defined before beginning work
- All requirements to be completely documented and signed-off by the business before beginning
- To provide exactly what users were promised, nothing more and nothing less.
- Know your audience and what they need the report to help them do.

Requirements Gathering
Determining your SAP WEBI reporting requirements involve defining (WHW):
- What will be measured
- How much it should improve by
- When it should improve by the targeted amount.
We call this the WHW model. This is a handy short-cut to determining the critical few KPIs vs the trivial many.
Your requirements will also dictate what data has to be populated in your universes or whichever data provider you are using.

Wireframing
Pencil and Paper First
You should always start your design process with your users by wire-framing. The best and cheapest way to do that is with a good old pencil and paper. Yes, there are fairly well established interaction models you should use and skilled Webi Consultants will know and use the best ones.
End users need to be involved every step of the way. Even better if the design team can interact with the users in their day-to-day environment, on the shop floor or in their office. What people say they need is often far different than what you find out from good user research.
From Pencil and Paper to Prototype Design
Many wire-framing tools exist, and many more will be released to the market. Most are reasonably priced while others are enterprise class tools with prices to match. It takes skill both with the tool, user requirements gathering, a bit of artistry and leadership to develop models that users will accept.

Universe Design
Designing your universes must be done with great care. You have to balance the need to get all of the right information into your cube while keeping out the unnecessary.
Proper Universe Design requires advanced data modeling skills coupled with deep business knowledge of a particular clients business processes.

User Acceptance
The Gold Standard of Success
In order to achieve a high level of user acceptance, it is necessary to design dashboards that truly help them do their jobs. Keeping it simple is a good design paradigm, while it may be necessary in some areas for some level of complexity.
Here's the Secret Sauce
Training. Then more training. Ensure the data the system is producing is both useful and meets the user requirements - but no more. Change is hard and takes time. But it can be done.

Continuous Improvement Phase
We must Balance Planning with Iteration
It is unlikely that the requirements your users have today will be the same as they have tomorrow. The business will change, the competitive environment will change, the people will change. The BI Platform product suite and its related technology capabilities will also change as will user expectations. As an information design tool, SAP BO Webi reports should support the user in whatever job they're doing. Once you're live with your first Webi report project, you will probably have a whole list of parked requirements.
How To Use Google Keyword Planner Tool Tutorial
It is time then, to prioritize the next batch of requirements. You become a digitally driven company by continuously learning and improving your use of the tools, like Webi.
