Time To Learn About Modeling SAP BW Key Figures
As you dive deeper into SAP datawarehouse concepts, you will need to learn how to model Key Figures. You will most likely have many questions as to just what a key figure is and will need some guidance on how to model them.
We have prepared a short guideline as part of our on-going series of How-To guides called Modeling Key Figures.
In it you will learn:
- Modeling Options for Key Figures
- Dynamic versus Persistent Key Figures
- Factless Key Figures
- Fact or Attribute
- Transactions
- Exception Aggregation
- Cumulative vs. Non-Cumulatives
- Elimination of Internal Business Volume
How To Use Google Keyword Planner Tool Tutorial
In order to get the greatest value from this short guide, you need knowledge of a specific industry, such as the Aircraft Industry (remember, building, maintaining and operating (MRO is a sub-segment within this!) are all separate industry segments within the broad general category of Aircraft Industry), knowledge of datawarehouse concepts, and a variety of SAP Business Warehouse Skillsets.
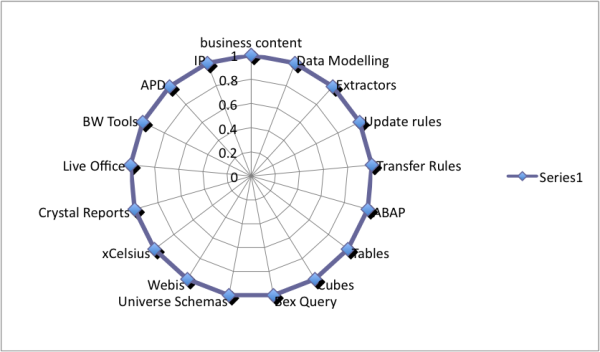 Required SAP BW Consultant Skill Sets
Key Figures are the central 'facts' stored in the SAP Business Warehouse (SAP BW) system, and are the answer a business user is typically seeking. For example, they might be looking for the FLC rate of a particular employee.
They are loaded into the Fact Table of an InfoCube during data loading and represent the results of the underlying transaction in the linked source system.
These source systems may or may not be SAP systems.
Inherent Meaning
In many cases, Key Figures are derived from the results of a process versus being a direct result of the underlying source system process.
For instance, a Source System may provide the Key Figures for Order Entry Quantity and Delivery Quantity, explicitly and will be represented by specific Key Figure InfoObjects in BW.
If you know these two pieces of data, then you can derive the Delivery Fulfillment Rate which can be expressed as the percentage delivery quantity represents of Order Entry Quantity.
Fundamental Design Decisions Required
This sort of derived Key Figure requires a modeling decision to be made:
- Should you create it in the transformation process and store it permanently in the Fact Table of the InfoCube
- Compute it each time in the query using a formula.
To make the right decision, why not take a look at our Key Figure Modeling Guide and learn more.

Thanks