
Every sales order, invoice, and delivery in your SAP Sales and Distribution (SD) system tells a story. It is a story about your business performance, your customers, and where you are headed next. But I have seen that most companies just collect this SAP data, and very few actually use SAP SD analytics to turn it into a real competitive edge.

For years, I have worked with executives, connecting their SAP SD data to BW and BusinessObjects. They all wanted the same thing you do, real-time visibility into their sales pipeline. The good news is that you do not have to guess what your data is trying to tell you.
You can make smarter, faster decisions about your sales strategy. If you feel like you are flying blind, we can help. You can boost your sales insights with our SAP SD consulting.
Need SAP Sales & Distribution Consulting.

Why SAP SD Analytics Matters for Sales Excellence
You have a constant stream of information flowing through your business every single day. This is the foundation of powerful SAP SD analytics. It is about seeing the complete picture of your operations, not just running a few reports.
Transactional Data Meets Strategic Insight
Your SAP SD module captures the whole order-to-cash cycle. This includes everything from quotes and sales orders to deliveries and invoices. These are not just records; they are clues to better performance.
Effective SAP SD reports pull this information together. They let you see trends you would otherwise miss. This is how you move from just processing transactions to making strategic business decisions based on solid business data.
The Hidden Value in Operational Data
Operational data holds immense hidden value. When you analyze it, you find key performance indicators (KPIs) that directly impact your bottom line. Think about metrics like Order Fill Rate or Gross Margin, which are critical for any sales organization.
These numbers show you exactly how healthy your sales process is. I have seen executives in aerospace and logistics use these exact KPIs to predict cash flow issues. They also used them to fix capacity problems before they became serious, impacting workforce planning and financial planning.
The Analytics Architecture — From SAP SD to Decision Making
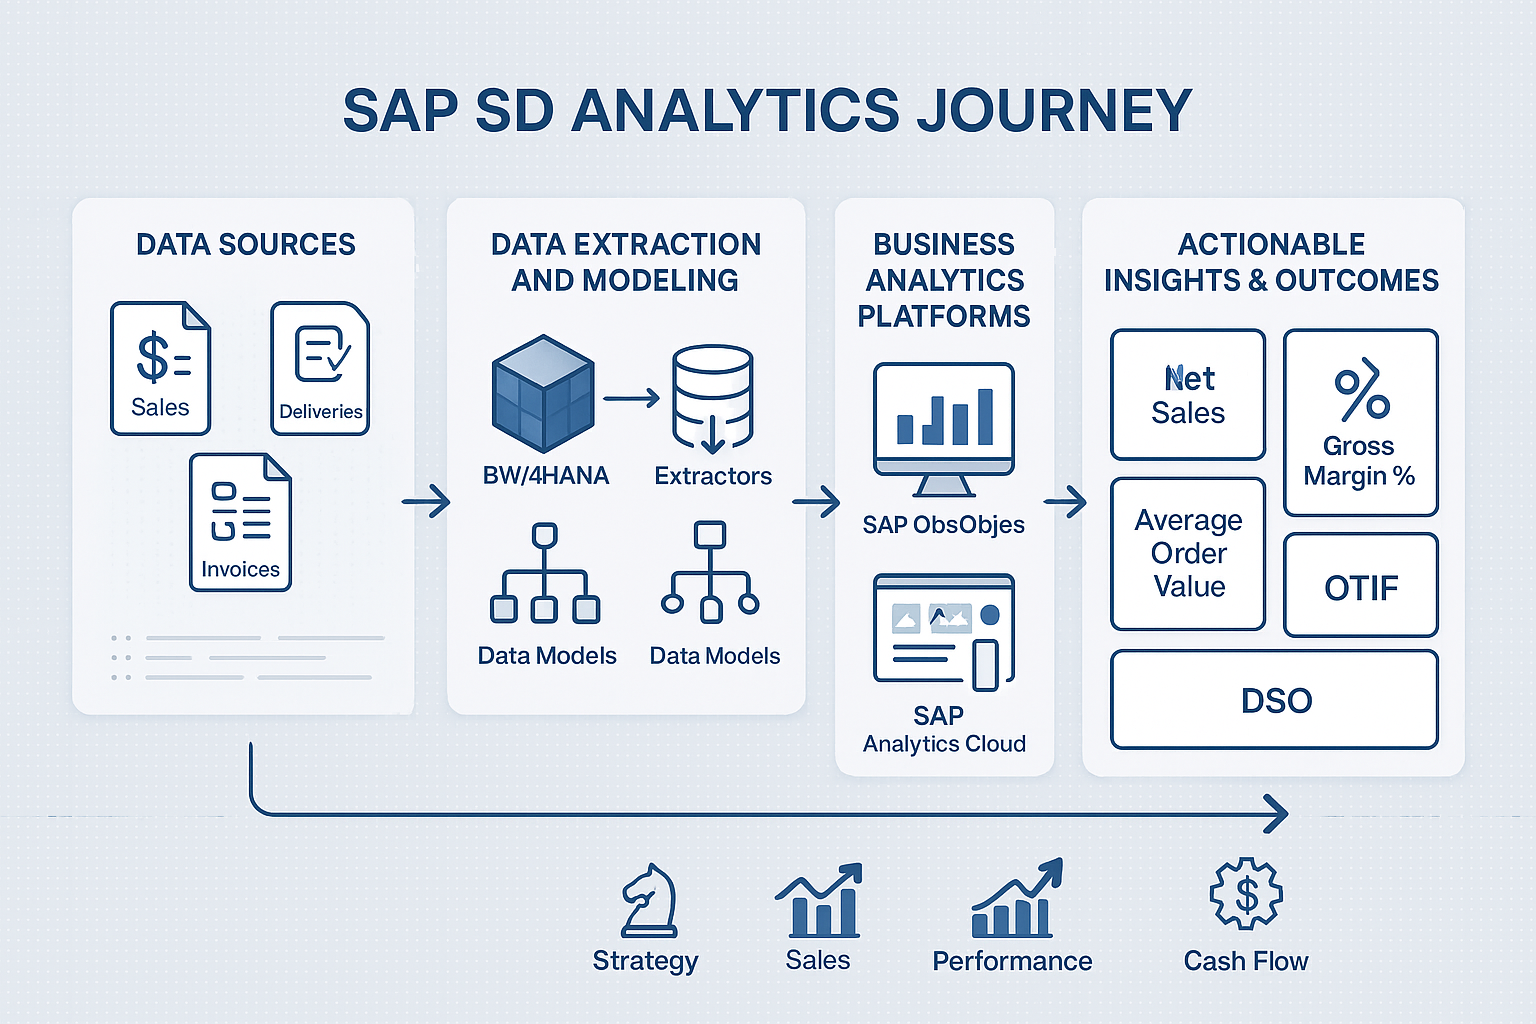
Getting insights from your data requires a solid technical foundation. It is a journey from the raw data in SAP SD to an interactive dashboard on your screen. You need the right analytics solutions working together on a modern business technology platform.
SAP BW/4HANA as the Data Foundation
Think of SAP Business Warehouse (or the newer BW/4HANA) as your central data hub. It uses Extractors, like 2LIS_11_VAHDR for sales document headers, to pull data reliably from various sources including SAP SD. From there, the data is modeled into structures like InfoCubes or ADSOs, which prepares it for analysis on the powerful SAP HANA database.
Why does this matter? Because this integration gives you clean, reliable business data. Without trustworthy information, any SAP BW sales analysis you do is just a guess, undermining your business intelligence efforts.
SAP BusinessObjects for Interactive Reports
This is where the data comes to life. Tools like SAP BusinessObjects (BO) let you create interactive reports and dashboards for detailed business analytics. You can easily build a report showing sales by region or profitability by product line, offering a clear user experience.
This approach lets your team explore the data on their own. They do not need to ask an IT person for every little question. They can just drag, drop, and find their own answers, which promotes data-driven decisions SAP-wide.
SAP Analytics Cloud (SAC) for Predictive Insights
SAP Analytics Cloud takes things a step further, providing a premier cloud analytics experience. It brings forecasting and planning into the mix, making it a powerful tool for sales planning and financial planning. You can use its features to predict future sales trends based on historical patterns with embedded analytics capabilities.
SAC, or SAP SAC as it is often called, also offers mobile-friendly dashboards and AI-assisted planning. Imagine your sales team checking their latest numbers right from their phone before a meeting. This platform is a central part of the SAP Business Technology Platform, connecting various data sources seamlessly.

Turning Data into Sales Performance Intelligence
Having the tools is one thing, but using them to drive real change is another. You need to apply these analytics sap solutions to specific business problems. Let's look at a few practical examples of how to improve business outcomes.
Use Case 1 — Revenue and Margin Trends
One of the most common uses for sales analytics is tracking revenue and profit margins. By pulling sales order and billing data into your business warehouse, you can spot your most profitable products or customers. Are certain regions outperforming others? This is how you find out and refine your strategy.
Use Case 2 — Discount and Rebate Impact
Discounts and rebates can eat into your profits if you are not careful. You need to know if they are actually helping you sell more or just giving away margin. By looking at pricing conditions data, you can directly connect discounts to profit erosion and make adjustments to your product lifecycle management.
Use Case 3 — Delivery and Fulfillment Analytics
Your customers care about getting their orders on time. By combining data from SAP SD and Logistics Execution (LE), you can track on-time delivery performance. This lets you improve your service levels and keep customers happy, strengthening your entire supply chain, which might involve tools like SAP Ariba.
Use Case 4 — Predictive Sales Forecasting
Guessing next quarter's sales numbers is stressful. But with predictive analytics, you can build much more accurate forecasts. By feeding historical SD sales patterns into a machine learning model in SAC, you get a data-driven look into future demand.
The rise of generative AI is making these predictions even more powerful. These technologies can analyze unstructured data from the SAP community and other sources to provide deeper context. Platforms like SAP Databricks or SAP Datasphere also provide advanced capabilities for complex data analytics projects.
Of course, this only works if your system is ready and the data is clean. You can read more about common issues that get in the way of getting good data quality. Data integration is a critical step that cannot be overlooked for achieving meaningful results.
Building the Right Data Model for SAP SD Analytics
A good analytics setup starts with a solid data model. This means paying attention to how data is extracted and organized. Getting this right from the start saves you countless headaches down the road and forms the backbone of your business data cloud.
Data Extraction Best Practices
SAP gives you standard extractors for pulling data from SD. It is important to use these and understand how they work with delta updates. This practice means you are only loading new or changed data, which keeps the process efficient.
You also need to align these extractions with your company's sales organizational structure. This alignment confirms the reports reflect how your business actually runs. The SAP business content provides pre-built extractors and models that can accelerate this process.
Cross-Module Integration
Your sales data becomes much more powerful when you combine it with information from other areas of your SAP enterprise system. Think about integrating it with Materials Management (MM) and Financial Accounting (FICO). This creates a complete view of profitability, linking sales activity to inventory costs and financial results.
This integration can happen within a single technology platform, like the SAP Business Technology Platform. It helps create a single source of truth for all business planning activities. Data from different sources, including SAP HANA, can be unified for a holistic view.
Data Governance and Quality Controls
Your analytics are only as good as your data. You must have clear rules for data governance. Inconsistent sales area mapping is the number one cause of reporting discrepancies I have seen.
Set up master data ownership and use data validation reports to catch errors early. Solutions like SAP Datasphere can centralize your data management, making it easier to maintain high-quality information across your SAP business data cloud. Clean data is a must-have for any successful sales performance dashboard.
Designing a Sales Performance Dashboard
Your dashboard is how you communicate insights to your leadership team. It needs to be clear, concise, and focused on what matters most. Do not try to show everything; just show the right things to support key decisions.
Executive KPI Design
When you are building a dashboard for executives, focus on the KPIs that connect directly to business goals. These metrics should tell a story about things like profitability and cash flow. A good dashboard helps leaders see if they are on track to meet their strategic objectives for business planning.
Top 5 Sales KPIs Tracked via SAP SD Analytics
Here are some of the most critical KPIs that executives I work with always want to see.
| KPI Name | What It Measures | Why It Matters |
| Net Sales | Total revenue after deductions. | Shows the core revenue-generating power of the business. |
| Gross Margin % | The percentage of revenue left after cost of goods sold. | Measures profitability and pricing efficiency. |
| Average Order Value | The average amount spent per order. | Helps understand customer buying behavior. |
| On-Time-In-Full (OTIF) | The percentage of orders delivered on schedule and complete. | A key indicator of customer satisfaction and supply chain health. |
| Days Sales Outstanding (DSO) | The average number of days it takes to collect payment after a sale. | Reflects cash flow efficiency. |
Visualization and Layout Principles
People absorb information differently, so use a mix of charts and tables to present your business content. Keep the layout simple and intuitive for a better user experience. An effective approach is a four-panel layout: one for revenue, one for top customers, one for sales pipeline, and one for profit margins.
It is also smart to create role-based dashboards with different cookie preferences for personalization. An executive needs a high-level overview, but a sales manager needs to see details for their specific team. Customize the view for each audience to provide relevant insights from your data cloud.
From Reports to Revenue — Driving Action Through Insights
Analytics should not just be about looking at the past. The goal is to drive future action that boosts your bottom line. You have to close the loop between the insights you find and your day-to-day sales operations.
Close the Loop with Performance Management
Use the insights from your dashboards to set realistic sales targets. Track forecast accuracy and adjust your plans accordingly with tools like Solution Manager for lifecycle management. You can even tie sales incentive plans directly to the KPIs you are measuring to motivate your team.
Example Case Study
In a global retail project I managed, the company was drowning in manual spreadsheets. By linking their SD data with BW, we reduced reporting time by 70%. More importantly, it allowed them to track profitability down to the individual store level for the first time.
This gave them the visibility they needed to make smart decisions about products and promotions, affecting their product lifecycle. It completely changed how they managed their sales performance and is a great example of the benefits of connecting SAP managed systems. This shows the true power of good analytics and data integration.
Getting Started with SAP SD Analytics
This might seem like a lot to take on, but you do not have to do it all at once. The best approach is to start small and build from there. Here is a simple roadmap you can follow.
Step 1 — Analytics Assessment
Start by looking at what you already have. Audit the quality of your current SD data and check what standard SAP extractors are available in your system. This helps you understand your starting point and what is needed from your technology platform.
Step 2 — Quick Wins
Do not try to build the perfect system right away. Go for some quick wins to show value early. You could implement a few standard BW sales reports or use pre-built business content packages in SAP Analytics Cloud for immediate impact.
Step 3 — Full Analytics Roadmap
Once you have built some momentum, you can develop a full roadmap for your SAP business. This is where you can plan for more advanced features like predictive forecasting and real-time dashboards with cloud sap analytics cloud. Think about where you want to be in a year and work backward, possibly including a migration to SAP Datasphere, SAP's business data cloud solution.
You do not have to figure this all out alone. If you want to accelerate your journey, let us talk. You can boost your sales insights with our SAP SD consulting services and make better business decisions.
Conclusion
Effective SAP SD analytics transforms raw sales transactions into real strategic insight. It closes the gap between the operational side of your business and the executive decisions that drive growth. It is about seeing the full story your sap business data is trying to tell you, so you can write a better next chapter for your company.
With tools like SAP Analytics Cloud and SAP Datasphere, the possibilities for deep data analytics are immense. From sales analytics to comprehensive business planning, the SAP ecosystem offers powerful solutions. At SAP BW Consulting, we help you bridge that gap so you can turn your sales data into your biggest asset.
Ready to see what your data can really do? Let's connect. Book a meeting with me, Lonnie Ayers, PMP, at this link.
Need Expert SAP Consulting Expertise?
We are team of top-level SAP consultants, focused on helping you get the most value from your SAP investment. Whether you need a single SAP SD consultant or an entire team of SAP experts, we can provide them. Please our book a meeting service to get started.