Growth readiness vs activity is the question that haunts a lot of busy leadership teams right now.
You look at your calendar, your project list, your SAP backlog, and you see non stop motion. Then you look at your pipeline or your EBIT, and you think this cannot be all there is for the level of effort.
If that is you, growth readiness vs activity is not an academic topic. It is the missing language that finally explains why your people look maxed out while your growth curve looks flat.

If you’d like to see where your organization currently stands, take the Digital Growh Readiness Scorecard.
Growth Readiness vs Activity: Why Effort Isnt the Problem
I work with CEOs and CIOs who run serious operations. They often run on SAP, with mature teams and large budgets.
They do not suffer from a lack of ideas or a lack of hard work. What they suffer from is a hidden constraint that nobody has named.
They try to solve a readiness problem with more activity, then blame execution when results stall. We need to answer deeper questions about why this happens.
Often, leaders focus on high energy inputs without measuring the structural capacity to handle them. They look for potential improvement in the wrong places.
Why So Many Busy Businesses Still Do Not Grow
You probably feel it every quarter.
Your people are slammed, yet revenue behaves like a stubborn flat line. The harder you push, the less responsive the system feels.
That is not laziness. It is physics.
Busyness vs Actual Progress
Busyness is about the number of tasks in motion. Progress is about how many of those tasks actually change outcomes that matter.
In SAP terms, you can be doing ten enhancement projects at once and still not move your core business KPIs. You might close dozens of tickets and ship many change requests.
Yet, you still see the same customer lead time, the same fill rates, and the same DSO. The problem is not activity itself.
It is the misalignment between activity and readiness. Just as you monitor training load in sports to avoid injury, you must monitor load in business.
The Trap of False Momentum
False momentum feels like movement, but it is mostly noise.
Your weekly steering decks look full and project boards overflow. However, the few metrics that truly matter refuse to budge.
The organization feels tired and strangely stuck at the same time. Research on change efforts in health systems has seen this same pattern.
A lot of work starts, yet only a fraction reaches real implementation in practice. This is shown in several implementation science studies.
These include long term reviews that track the gap between plans and sustained change. One BMJ study highlights these discrepancies clearly.
Another BMJ Quality and Safety paper confirms the trend. You must check if your score reflects real gains or just friction.
Growth Readiness vs Activity Explained
To fix the stall, you first have to separate effort from readiness.
Effort is what your teams are doing. Readiness is the condition of the system they are doing it in.
If readiness is low, more activity just adds friction and cost.
Three Different Variables: Effort, Capacity, Alignment
I look at growth readiness as a simple mix of three things.
| Element | What It Means | Growth Question |
|---|---|---|
| Effort | How much activity is happening | Are people working hard |
| Capacity | People, systems, and processes able to absorb more work | Can we take on more without breaking |
| Alignment | How tightly effort ties to real outcomes | Are we working on the right things |
You probably have high effort already.
Capacity is often thinner than leaders think. This is especially true with heavy SAP landscapes and fragmented data flows.
Alignment is where most of the value either compounds or dies.
The readiness question is simple. If you poured more pipeline, budget, and activity into your business today, would results scale with it?
Or would problems scale instead?
Readiness vs Enablement vs Raw Hustle
Many leaders also mix up readiness with enablement.
A useful contrast comes from sales. Experts talk about readiness vs enablement as two related but different things.
Enablement gives people tools, scripts, and content. Readiness means those people can actually use what they have in real situations to hit the number under pressure.
Activity is like raw hustle. Enablement is support gear.
Readiness is the mix of structure, clarity, and capability that converts both of those into growth without burning people out.
The Physiology of Business Performance
Business leaders can learn a lot from how elite athletes monitor their performance. Athletes use detailed metrics to determine their training readiness.
They look at a readiness score that aggregates various data points to decide if they should push harder. In business, we often ignore the equivalent of a sleep score or resting heart rate.
We push for high-intensity activities without checking if the organization has had enough recovery time. This leads to a breakdown in the system.
Analyzing Your Organizational Health
Consider how an individual uses health tech like the Oura app to track their physical state. They monitor their body temperature and hrv balance to understand their daily capacity.
A business has similar activity contributors. Your operational efficiency is like a resting heart rate.
If your average resting heart is too high, your baseline stress is unsustainable. You need to identify what your readiness contributors are.
Are your teams getting enough downtime, or are they constantly in overdrive? We need to establish a way to improve readiness score metrics across the company.
Just as an athlete might adjust their training load based on their scores, you must adjust workloads. If the activity score reflects burnout, you must pull back.
Ignoring these signs is like ignoring high blood pressure until it becomes a crisis. You might need to enter a corporate rest mode to consolidate gains before the next push.
Real expansion is like muscle growth; it happens during the recovery phase, not just the lift. We should strive to meet Oura levels of insight in our corporate data.
Check your long-term average performance rather than just daily spikes. Even light activity can move the needle if it is aligned correctly.
How Activity Masks Growth Constraints
The busier everyone gets, the harder it is to see that the structure is not ready.
Signals that would warn you early are buried under daily noise. So leadership calls for more effort instead of better diagnosis.
Noise vs Signal in a High Activity Environment
Imagine the cockpit of a modern aircraft.
If your navigation and radios, autopilots, and flight displays are feeding clean, aligned information, pilots can fly high workload phases without losing the plot. You can see this in integrated solutions such as advanced navigation and radios.
Similar clarity comes from autopilots and flight displays and instruments. But if those streams are scattered, uncalibrated, or slow, more data just means more noise.
It looks impressive but adds risk. Busy businesses fall into the same trap.
Data is everywhere, yet there is almost no clear signal that helps with decisions.
Leadership reviews piles of project status, Jira boards, and SAP BW reports.
Yet nobody can answer a blunt question fast. What precise change in our digital landscape last quarter produced that small bump in margin?
When the signal is that fuzzy, you are flying on gut feel.
Misinterpreting Effort as Effectiveness
The human mind likes to see effort and assume effectiveness.
If people are exhausted, we assume we must be moving. Yet research on large change programs shows that perceived effort often has very little to do with real outcomes.
Across healthcare improvement projects, for example, researchers saw heavy effort across many teams. However, the translation to real patient outcomes or sustained process change was spotty.
This is documented in several long running reviews and meta studies. One leadership and workload study highlights this disconnect.
A Cochrane change review found similar results. Another implementation sustainability paper confirms the finding.
So if you feel a strong temptation to measure how hard your teams are working, notice that urge. Do not just look at what is actually changing in your SAP enabled processes.
It is a hint that you are judging activity because readiness is still invisible. This focus on training activities without strategy is a trap.
Why Scaling Activity Amplifies Weaknesses
Now comes the dangerous part.
If the system is not ready, and you scale activity anyway, you scale every weakness at the same time. This is where things snap.
Pressure Testing Your Systems the Hard Way
Think of your digital and process landscape like the avionics stack on an aircraft.
You can have world class integrated flight decks, engine indication systems, and datalinks on paper. But if they have not been fully wired, tested, and trained, that first intense flight will stress the system hard.
Any airline pilot will tell you about bringing together navigation and flight deck integration. The same applies to datalinks and connectivity.
It is also true for engine monitoring. Your business is no different.
If you pour more sales volume, new SKUs, and fresh market entries into a brittle system, you create problems. Aggressive SLAs into a system that still runs on half aligned SAP modules will fail.
Those stressors show you where the weak joints are. Except now, the pressure test is live, with customers and real cash.
Activity without readiness just raises the odds of public failure instead of controlled learning. You risk injury prevention protocols failing completely.
The Illusion of Control Through Dashboards
Leaders respond by asking for more reporting, more analytics, and more dashboards.
Those tools have value, especially if your aviation level data feeds or wearables are tuned and current. Pilots rely on current weather, traffic, and GPS wearables.
This data often comes from aviation weather sources. It also includes traffic surveillance systems.
Even portable GPS and wearables play a role. Regular aviation database updates are essential.
But reports do not fix structure. They simply describe the current state with more or less delay.
If your underlying growth model is confused, every new report is just a sharper picture of that confusion. And if your SAP configuration was never really lined up to match your growth strategy, it will fail.
Fancier analytics on top of messy data will not change readiness.
The Hidden Cost of Confusing Effort With Readiness
As long as leadership equates working harder with getting ready to grow, three predictable costs hit the business.
You have seen at least one of them.
Burnout That Looks Like Underperformance
Your best people slowly wear down under constant activity with little visible progress. Leaders might label it resistance.
What they are really watching is a group of capable professionals running a marathon on a treadmill. Several studies in clinical and administrative settings show this pattern.
Asking teams to push change without the right conditions leads to fatigue, frustration, and later disengagement. This is supported by a public health management study.
A health services research paper offers similar conclusions. Additional community engagement findings back this up.
Your SAP, IT, and business process experts are no different. If every quarter feels like another huge program layered on top of unfinished work, you do not have a performance problem.
You have a readiness gap. This is akin to training readiness score dropping while the athlete keeps sprinting.
Rising Costs With Flat Outcomes
The next cost is financial. More projects, more consultants, more technology, more licenses.
Yet the yield per dollar slips instead of climbing. Cross sector reviews of major improvement efforts keep finding the same thing.
Where structures, leadership clarity, and feedback loops are weak, returns fall even as investment climbs. A Milbank Quarterly review details this issue.
A large scale implementation study confirms it. Further evidence is found in a health services integration paper.
You might call it spending more for the privilege of staying stuck. That is exactly how a readiness blind spot shows up in your P and L.
Lost Confidence in Strategy and Data
There is also a softer, but very real, cost. Over time, your leadership team starts to doubt its own strategies, and sometimes even its own data.
Plans that once felt crisp start to sound like wish lists. Nobody can quite say why some projects land while others evaporate during rollout.
This problem is documented in change management literature. Plans, context, and readiness often drift apart.
See this early change readiness paper. A follow up on change practices explores this drift.
An implementation communications study also addresses it. The truth is simpler.
Your people did not suddenly become bad at strategy. The strategy was just never pressure tested for readiness before activity ramped up.
How to Determine If Your Business Is Actually Growth Ready
So how do you tell whether you are ready to grow, or just working very hard? You start with a blunt diagnostic, not with another plan.
You look for specific signals in five areas of your operation. These are the core pillars of success.
Five Practical Readiness Checks
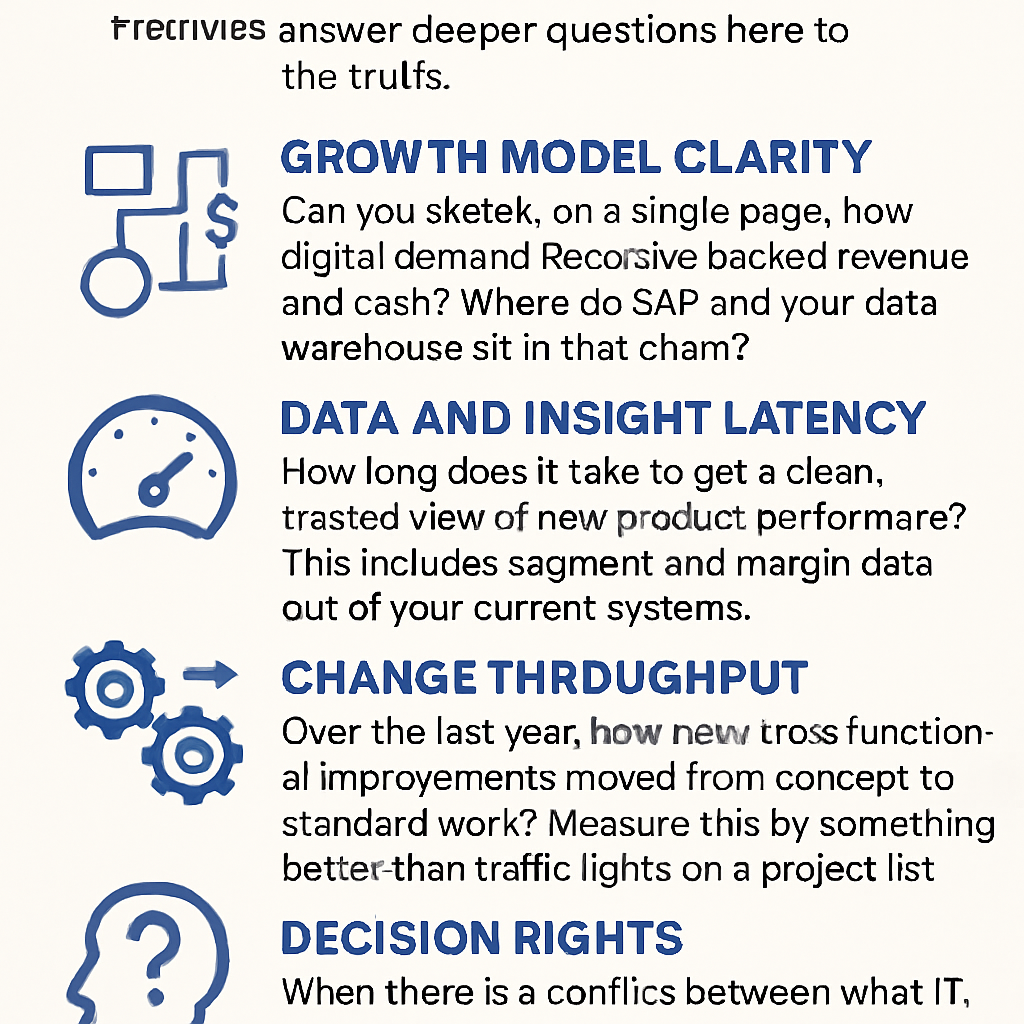
Here are five questions I use with CEOs and CIOs who rely on SAP for digital operations. Contributors answer deeper questions here to reveal the truth.
-
Growth Model Clarity
Can you sketch, on a single page, how digital demand becomes booked revenue and cash? Where do SAP and your data warehouse sit in that chain?
-
Data and Insight Latency
How long does it take to get a clean, trusted view of new product performance? This includes segment and margin data out of your current systems.
-
Change Throughput
Over the last year, how many cross functional improvements moved from concept to standard work? Measure this by something better than traffic lights on a project list.
-
Decision Rights
When there is a conflict between what IT, SAP teams, and line of business want, who decides? Who has the clear right to decide, and how fast can that person act?
-
Learning Feedback Loop
How fast does field learning or customer behavior feed back into changes? Does configuration, workflow, or content update without a huge formal program each time?
If your honest answers are vague or slow, that is not a moral failing. It is a structural readiness issue.
Researchers have studied this in hospitals and public systems. They label it organizational readiness for change and implementation climate.
See this organizational readiness concept paper. Review the determinants of sustainability.
Check this large scale program review.
The SAP and Digital Angle for CEOs and CIOs
For SAP based organizations, one extra check is critical. Ask yourself whether your SAP and data architecture reflect your current growth strategy.
Or does it reflect the strategy from five years ago? If the architecture lags the strategy, no amount of daily activity will make it ready.
You cannot just add more intensity activities to fix a broken frame. The potential improvement lies in alignment, not volume.
What Activity Scores Reveal About Your Business
We often track activity scores for employees, but what about the score contributors? Does a high score reflect productivity or just busyness?
Consider the components that make up your score contributor list. If activity time is high but outcome is low, you have a problem.
You must look at average resting metrics for your servers and teams. High resting loads indicate a system that cannot handle a spike.
Look for the pay attention message in your system logs. If you see a red progress bar constantly on deployments, pause.
Do not ignore the attention message that your ops team is sending. You are exploring a dangerous path if you ignore these warnings.
Inactive time is not always bad; sometimes it represents necessary maintenance. Just as muscle growth requires rest, business growth requires stabilization.
Avoid injury prevention issues by anticipating failures before they happen. You do not want to deal with the corporate equivalent of cardiovascular disease.
That is the slow clogging of your process arteries with bureaucracy. Review your internal privacy policy regarding data access to clear clogs.
Measure Growth Readiness Before You Scale
You would not launch a new aircraft without checking all systems in realistic conditions. Flight decks, audio panels, and engine indications would go through test after test.
Pilots train in simulators with flight planning tools. They use pilot planning apps.
They rely on flight plan services. They utilize the flight management portal.
You would test, learn, adjust, then fly for real. Your growth plans deserve the same discipline.
This is why we built the Digital Growth Readiness Scorecard for SAP centric businesses. It is not another activity to tick off.
It is a structured way to see your real starting point before you spend the next dollar on growth activity. The scorecard walks you through specific, grounded questions.
It covers your growth model, data flows, SAP configuration, decision patterns, and feedback loops. You get a simple, honest picture of where effort will convert into results.
You also see where it will likely leak out as cost, delay, or rework. No heroics, no magic formulas.
Just clarity. The Digital Growth Readiness Scorecard helps determine whether your business is structurally ready for growth.
It answers whether you are just working harder. If your calendar is full, your people are tired, and your growth line still looks bored, take action.
It might be time to step off the treadmill and run the diagnostic. Then, finally, your effort and your readiness can start to line up.
Take the time to meet Oura standards of introspection for your business. Look at your training readiness score objectively.
Identify the activity readiness gaps. Answer are you truly prepared?
Ensure your score drops are investigated immediately. Contributors answer deeper questions when they feel heard.
Stay active in your pursuit of alignment, not just busy work. Use the readiness score to drive your implementation strategies.
Long-term average performance is what matters, not daily noise. Do not let high energy bursts fool you into thinking you are stable.
Even light activity can move the needle if it is aligned. Temporarily mute the distractions and focus on the core.
Conclusion
Most CEOs and CIOs do not have an effort problem. They have a hidden readiness problem that is harder to see.
This is why the question of growth readiness vs activity matters so much. Once you separate those two in your mind, busyness stops being a badge of honor.
It becomes what it always was, just a data point. Real growth starts with a clear view of whether your business is truly ready to scale.
Prioritize your health, both personal and organizational, to improve performance. Time spent on readiness is never wasted.
Keep your recovery activity in mind as you plan for the next quarter. If you ignore the signs, the system will eventually fail.
Take the Digital Growth Readiness Scorecard
If you’re ready to strengthen your organization’s decision-making capability, start by taking the Digital Growth Readiness Scorecard.
It reveals your current level of digital growth readiness and highlights the fastest opportunities to improve clarity, alignment, and performance across the leadership team.
We are team of top-level SAP consultants, focused on helping you get the most value from your SAP investment. Whether you need a single SAP SD consultant or an entire team of SAP experts, we can provide them. Please our book a meeting service to get started.