
You just finished taking a decision intelligence maturity assessment. Now you are staring at your score and wondering what comes next.
Most executives feel this exact same way. They know their number, but they don't know what to do with it.
Your score isn't the finish line. It is actually where your journey begins.
A decision intelligence roadmap gives you clear steps forward. It shows you exactly what to fix first based on where you are right now.
Think of it like a GPS for better choices. You need to know your current location before you can map out the best route.
Poor decisions cost companies real money. Research shows that inefficient decision-making drains millions annually from average S&P 500 companies.
That is capital vanishing because leadership cannot access the right data at the right time. Or they are drowning in too much irrelevant information.
Most organizations fall somewhere on a spectrum. Some are barely surviving in reactive mode while others operate like finely tuned machines.
Your assessment placed you in one of four tiers. Each tier has its own set of challenges and opportunities for growth.
The roadmap we are about to walk through is built for real companies facing real problems. These aren't theoretical fixes.
This is practical guidance you can implement starting tomorrow morning.
If you’d like to see where your organization currently stands, take the Decision Intelligence Maturity Assessment.

What Your Maturity Score Actually Tells You
Your assessment gave you two critical pieces of information. First, you got an overall tier placement. Second, you received scores across five different categories.
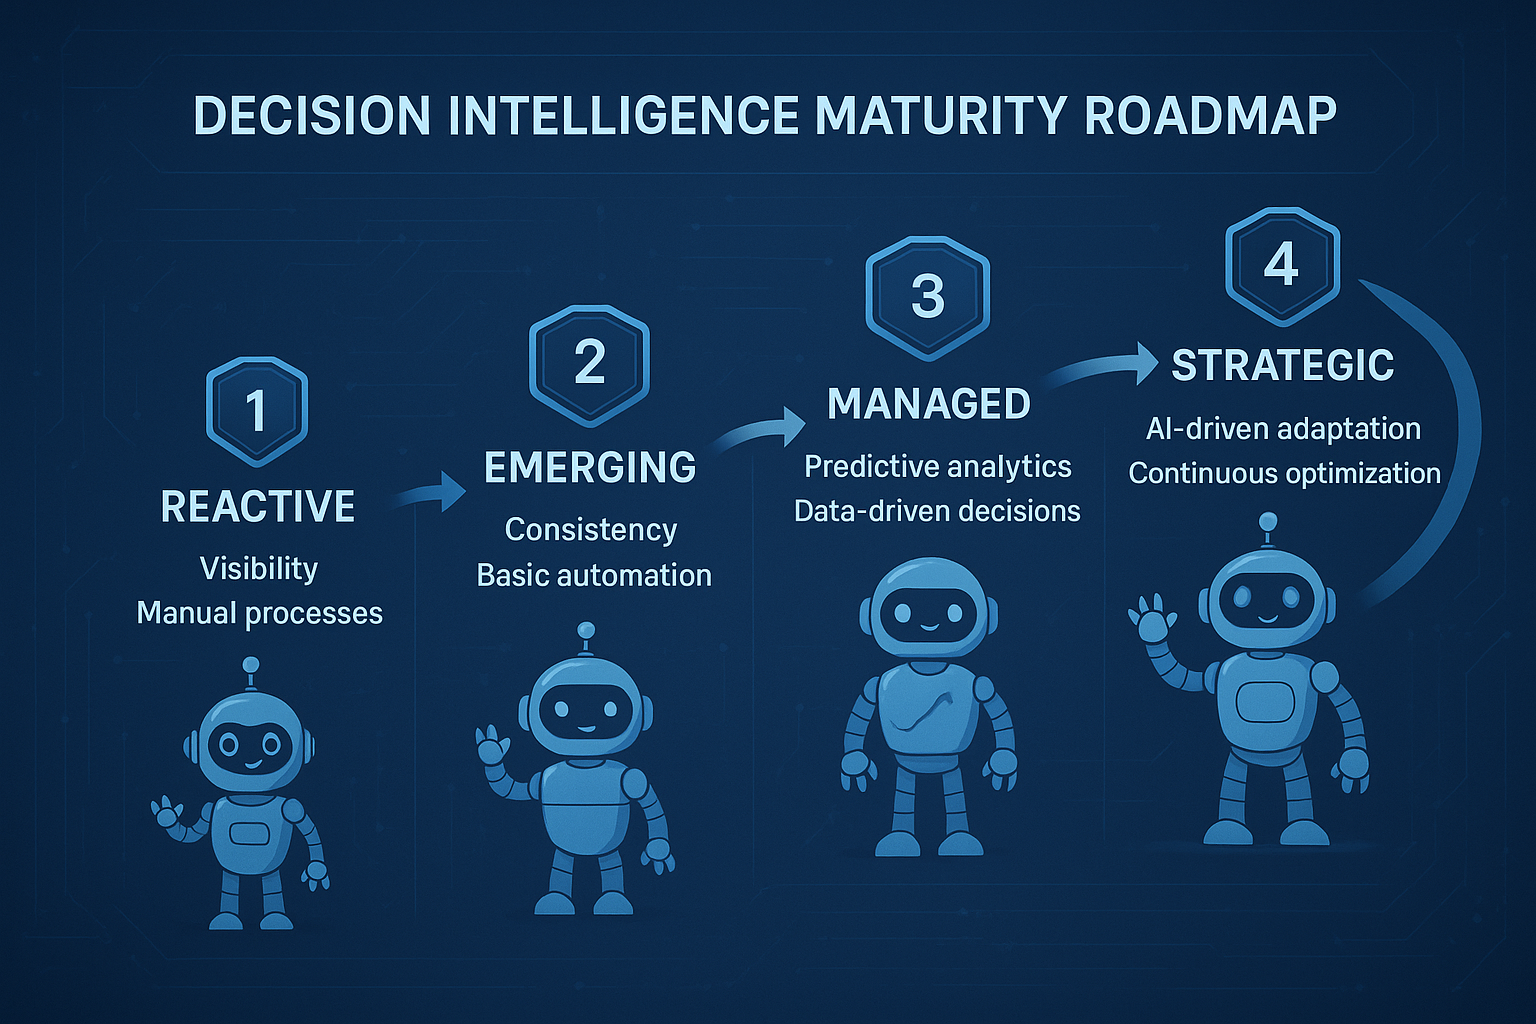
The four tiers are Reactive, Emerging, Managed, and Strategic. Each one represents a different stage of decision intelligence maturity.
Reactive organizations are firefighting constantly. Every choice feels urgent because there is no early warning system in place.
Emerging companies have started building consistency. They are moving beyond chaos but still struggle with alignment and visibility.
Managed organizations have solid processes. Decisions happen faster and with more confidence than most competitors.
Strategic companies operate at the highest level. They see around corners and make moves before problems appear.
Your category scores show where you are strong and where you are vulnerable. You might be great at your data foundation but weak on operational agility.
Or maybe your leadership culture is excellent but your dashboards are nonexistent. These gaps matter because they reveal what stops your progress.
Scores vary across categories for a reason. Organizations grow unevenly.
You might have invested heavily in data infrastructure while neglecting decision quality. That creates blind spots that slow everything down.
Once you know where the gaps are, you can close them systematically. Your score isn't a judgment.
It is a diagnostic tool that shows you exactly where to focus your energy to achieve your business goals.
The Roadmap for Reactive Organizations
If your assessment placed you in the Reactive tier, you are dealing with constant urgency. Decisions get made in crisis mode because you lack visibility.
The first priority is establishing a single source of truth. Right now your teams are probably working from different versions of reality.
Sales has one set of numbers. Finance has another. Operations is looking at something completely different.
This creates confusion and slows everything down. You need one place where everyone goes to see what is actually happening.
Start by identifying your core decision-making process. What choices does leadership make every week that impact the business?
These might include inventory purchases, hiring decisions, pricing changes, or resource allocation. Write them down.
Next, figure out what KPIs should drive those choices. If you are deciding whether to hire, you need data on workload, capacity, and growth projections.
Once you know what matters, you can start cleaning and aligning your data. This doesn't mean a massive data warehouse project.
It means making sure the numbers that matter are accurate and accessible. Focus on the vital few rather than the trivial many.
Basic dashboards come next. You need visibility into what is happening right now, not what happened three weeks ago.
These dashboards should surface problems the moment they appear. Think of them as your early warning system.
Finally, standardize your leadership reporting cadence. Pick a rhythm and stick to it.
Consistency builds trust. When everyone knows the rhythm, they can prepare properly.
This phase feels hard because you are building muscle you didn't have before. But stick with it.
The payoff is moving from constant firefighting to actually running your business using structured data.
The Roadmap for Emerging Organizations
Emerging organizations have momentum but lack consistency. You have started building better processes but they are not fully mature yet.
Your first priority is consolidating reporting. You probably have multiple reports floating around that tell slightly different stories.
Bring them together into one coherent system. This reduces confusion and speeds up decision cycles.
Next, reinforce your data pipeline and governance. You have data flowing but it is probably messy in places.
Clean up the gaps. Make sure everyone understands where data comes from and how it gets updated.
Align leadership around shared KPIs. This sounds simple but it is often the hardest step.
Different departments care about different metrics. You need agreement on what actually matters for the business as a whole.
Introduce threshold-based dashboards using defined business logic. These show you when things cross important boundaries.
For example, when inventory drops below a reorder point or when labor costs exceed budget by a certain percentage.
Thresholds help you spot problems before they become crises. They give you time to respond thoughtfully instead of reactively.
Improve your early-warning visibility. What signals tell you trouble is coming?
Maybe it is declining order velocity or increasing customer complaints. Build those indicators into your dashboards to improve data quality and help decision velocity.
Reduce manual reporting processes wherever possible. If someone is copying and pasting data into spreadsheets every week, automate it.
Manual processes create errors and waste time. They also prevent you from scaling effectively.
Research from Bain shows a strong connection between decision effectiveness and business performance. Companies that make better choices consistently outperform their competitors.
At the Emerging level, you are building the consistency that separates good companies from great ones.
The Roadmap for Managed Organizations
Managed organizations have solid foundations. Decisions happen efficiently and leadership has good visibility.
But you are not done yet. There is a big difference between good and excellent.
Your next step is introducing predictive dashboards. These do not just show what is happening now.
They show what is likely to happen next to help forecast outcomes. Predictive dashboards use historical patterns to predict future states.
They help you make decisions proactively instead of responsively. Strengthen your scenario modeling capabilities.
What happens if demand increases by 20%? What if a key supplier fails in your supply chain?
Being able to model scenarios helps you prepare for multiple futures. You can test decisions before committing resources.
Improve forecasting accuracy across all critical areas. This includes revenue forecasts, cost projections, and capacity planning.
Small improvements in forecasting create huge advantages. They let you position resources more effectively.
Eliminate noise from your dashboards. At this level, you probably have a high data volume.
Cut out anything that does not drive decisions. Every metric on a dashboard should answer a specific question.
Build automatic alerts for critical thresholds. Leaders shouldn't have to check dashboards constantly.
The system should notify them when attention is needed. This frees up mental bandwidth for strategic thinking.
Reinforce cross-functional alignment. Different departments should be working from the same playbook.
When sales, operations, and finance are aligned, execution becomes dramatically faster.
This is where SAP and BW optimization really pays off. Fine-tuning parameters and master data creates cleaner outputs.
We have seen companies reduce forecast error by 40% just by fixing data alignment issues in their ERP systems.
At the Managed level, you are moving from efficiency to excellence. You are building a competitive advantage using data-driven insights.
The Roadmap for Strategic Organizations
Strategic organizations operate at the highest level of maturity. Decisions happen fast, with confidence, and they are usually right.
But staying at the top requires continuous effort. You cannot coast on past success.
Your priority is continuous tuning. Markets change, competitors evolve, and customer preferences shift.
Your decision systems need to adapt constantly. Schedule regular reviews to make sure everything still works.
Conduct annual KPI alignment reviews. What mattered last year might not matter this year.
Make sure your metrics still reflect your strategic priorities. Cut ones that don't drive action.
Build resilience into your data pipelines. Strategic organizations cannot afford downtime or data failures.
Redundancy and monitoring become critical. You need systems that heal themselves automatically.
Explore advanced forecasting techniques. Machine learning models, external data integration, and alternative data sources are vital here.
The more sophisticated your forecasting, the better your positioning for future opportunities.
Executive performance dashboards become essential. Leaders need visibility into not just business performance but decision performance.
Are decisions getting made faster? Are they producing better outcomes? Track this systematically.
Drive cross-functional decision integration. Break down the remaining silos between departments.
The best strategic decisions span multiple functions. Your systems should support that naturally.
Introduce benchmarking and competitive insight. How do your choices compare to industry leaders?
Where are competitors making different choices? This external perspective prevents groupthink.
Train leadership in decision behaviors. It is not just about systems and data.
It involves human judgment and how people interact with information. Better decision hygiene creates better outcomes.
Teach leaders to recognize biases and question assumptions. According to Gartner, decision intelligence is a top technology trend because it fundamentally changes how organizations operate.
Strategic organizations do not just use decision intelligence. They build it into their DNA.
Summary of Roadmap Tiers
| Tier | Primary Focus | Key Action Items |
|---|---|---|
| Reactive | Crisis Management | Establish a single source of truth and basic business users access to data. |
| Emerging | Consistency | Consolidate reports and improve data quality through automation. |
| Managed | Predictive | Implement predictive modeling and prescriptive analytics. |
| Strategic | Adaptation & AI | Leverage artificial intelligence and generative ai for continuous tuning. |
Managing the Data Ecosystem and Compliance
As you move through these stages, your data ecosystem will grow more complex. This often involves integrating external data for targeted advertising or customer behavior analysis.
It is critical to manage how data enters your systems. This brings up technical configurations regarding privacy and consent.
When collecting web-based data, you must configure your decision intelligence platforms to respect user choices. This includes handling functional cookies and performance cookies correctly.
Administrators often face a configuration cookie list that dictates what data flows into the analytics engine. You might see settings for a checkbox label or a label label within your consent management tools.
Your team needs to verify that the cookie list clear functions work when a user opts out.
If a user clicks to cancel consent, the system must apply cancel consent logic immediately.
Sometimes you have to manually apply cancel protocols to remove historical data. Verifying the checkbox label label confirm status ensures you are compliant.
Technical teams should monitor the label confirm and checkbox label label settings in the backend. This ensures that only relevant insights are generated from compliant sources.
You need to check if cookies active status aligns with current regulations. Using label label confirm settings correctly prevents data leakage.
While this sounds technical, it protects the integrity of your holistic data. Clean, compliant data is the fuel for reliable intelligence.
How Dashboards Accelerate Every Stage of the Roadmap
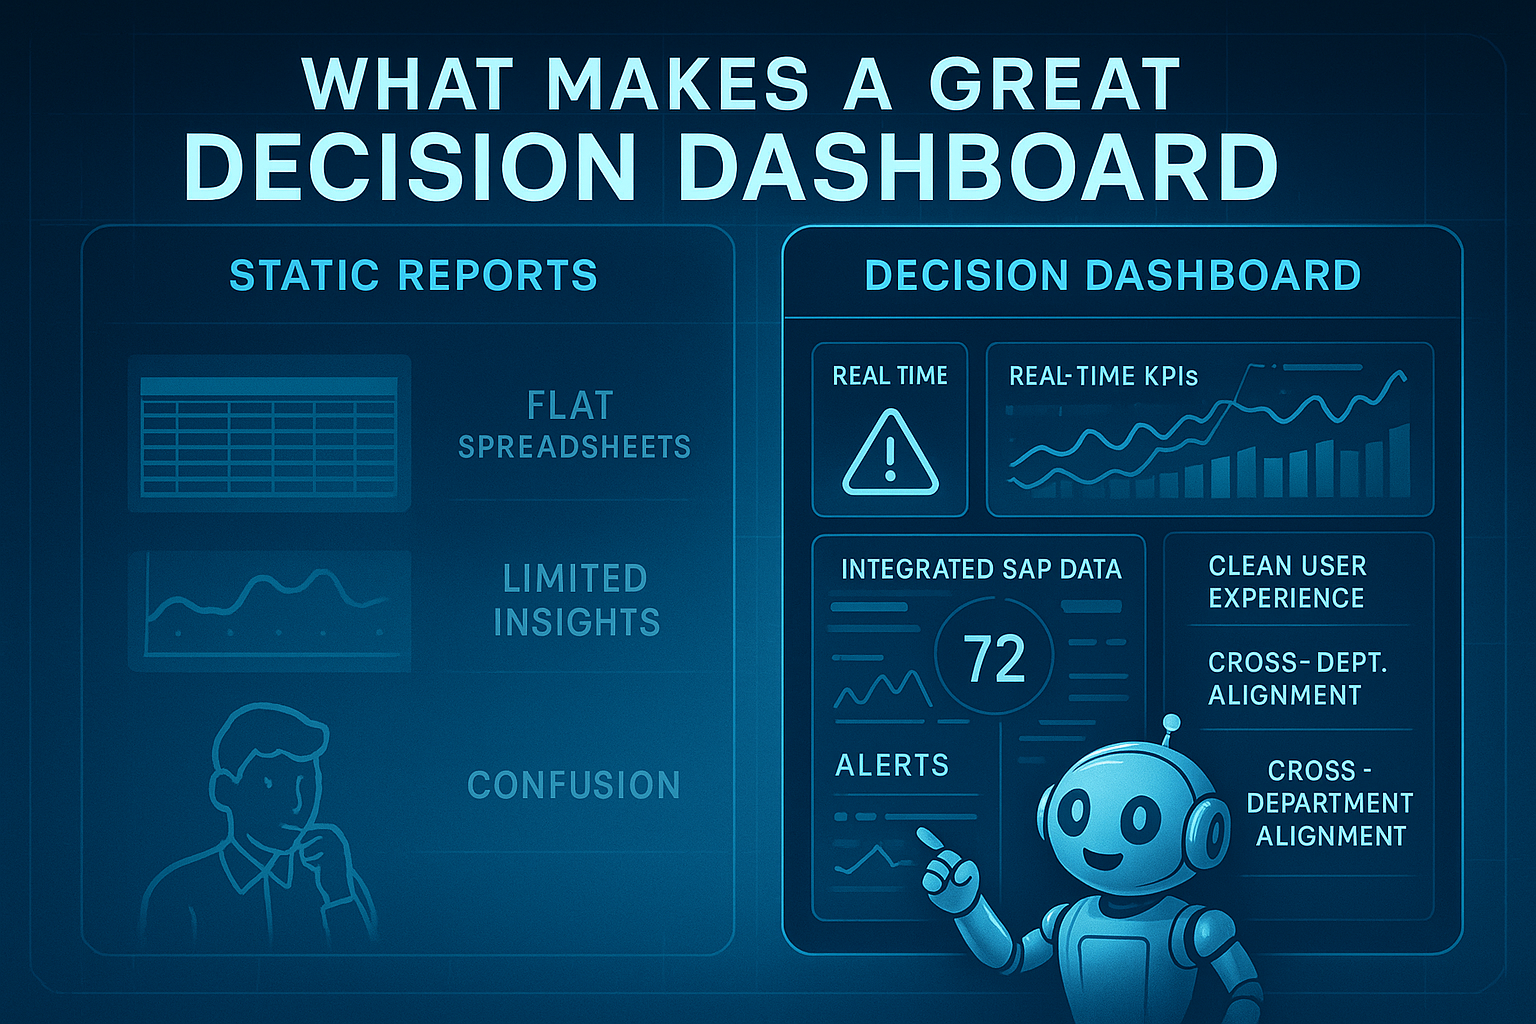
Dashboards are not reports. That distinction matters more than most people realize.
Reports tell you what happened. Dashboards help you make decisions about what happens next using actions based logic.
At every maturity level, dashboards serve as your decision infrastructure. They surface the information that matters when it matters.
Dashboards reveal anomalies immediately. When something moves outside normal patterns, you see it right away.
They also show drift over time. Small changes that build up gradually become visible.
Most importantly, dashboards create unity across leadership. Everyone looks at the same information and speaks the same language.
This eliminates the version control problem where different leaders have different understandings of reality.
For SAP users, dashboards transform raw transactional data into executive clarity. SAP contains incredibly rich information.
But most of it stays buried in tables and transactions. Dashboards pull out what matters and present it clearly.
We worked with a manufacturing client who was constantly missing forecast targets. Their SAP system had all the right data.
The problem was nobody could see the misalignment between demand planning and MRP parameters. We built dashboards that surfaced these gaps.
Within three months, forecast accuracy improved by 35%. Inventory turns increased and stockouts decreased.
The data was always there. They just needed a way to see it and act on it.
That is what great dashboards do. They close the gap between having data and making decisions.
How to Start Your Decision Intelligence Transformation
Knowing where you are is half the battle. Knowing what to do next is the other half.
Start by getting absolute clarity on the decisions that matter most. Not all decisions are created equal.
Some choices move the needle significantly. Others barely register. Focus on the ones with real impact.
Audit your data sources and pipelines next. Where does your decision data come from?
Is it accurate? Is it timely? Are there gaps or inconsistencies that create confusion?
Evaluate your current dashboards honestly. Do they answer specific questions? Do leaders actually use them?
Many organizations have dashboards that nobody looks at. That is a waste of resources.
Standardize KPI definitions across the organization. Finance's version of "revenue" should match sales' version.
This sounds basic but it is often broken. Different departments calculate the same metrics differently.
Consider conducting a formal Decision Intelligence Review. This is a structured assessment that goes deeper than a simple maturity score.
A review examines your data architecture, decision processes, dashboard effectiveness, and organizational alignment.
It identifies specific bottlenecks and creates a prioritized action plan. You get a clear roadmap customized to your situation.
Research shows that eight in ten organizations say data is critical for decision-making. Yet 41% of business leaders do not fully understand their data.
That gap represents opportunity. Closing it creates competitive advantage.
The decision intelligence market is growing at a compound annual growth rate of 15.2%. Organizations are investing heavily because the returns are real.
Better decisions mean faster growth, lower costs, and stronger market position.
Frequently Asked Questions About Decision Intelligence
What is the difference between Business Intelligence (BI) and Decision Intelligence (DI)?
While business intelligence focuses on descriptive analysis of historical data, intelligence di goes further. BI focuses on showing you what happened in the past through reports.
Decision intelligence di focuses on the future and the specific actions you should take. It connects data analysis directly to the decision-making process to explain performance and recommend the next steps.
How does Artificial Intelligence fit into this roadmap?
Artificial intelligence and data science act as accelerators for your roadmap. Tools utilizing natural language processing allow business users to ask questions in plain English.
Advanced di tools use decision intelligence ai to uncover hidden patterns in unstructured data. This human-ai collaboration allows for enabling faster and more consistent decisions.
Do we need to replace our current BI tools?
No, di builds upon your existing bi tools and crm systems. It is an overlay that adds logic and language processing to your current stack.
It integrates complex data from various sources to provide holistic data views. This di approach enhances your current investments rather than replacing them.
Conclusion
Your decision intelligence roadmap is not about perfection. It is about progress.
Every organization starts somewhere. What matters is taking the next right step based on where you are now.
Reactive organizations need to build visibility and consistency. Emerging companies need to strengthen their foundations.
Managed organizations should push toward predictive capability. Strategic companies must stay sharp through continuous improvement.
The roadmap gives you a clear path forward regardless of your starting point. It shows you what to fix first and why it matters.
Remember that decision intelligence is a capability, not a project. You do not implement it once and move on.
It grows with your organization. As you mature, your needs change and your systems should evolve accordingly.
We help clients build the dashboards, data pipelines, and decision systems that support this growth. We specialize in SAP and BW environments where complexity can hide opportunity.
Your assessment score showed you where you stand. The roadmap shows you where to go next.
The question is: are you ready to take the first step?
If you’re ready to strengthen your organization’s decision-making capability, start by taking the Decision Intelligence Maturity Assessment. It reveals your current level of decision intelligence and highlights the fastest opportunities to improve clarity, alignment, and performance across the leadership team.
Take the assessment now and discover your path to higher executive performance.
We are team of top-level SAP consultants, focused on helping you get the most value from your SAP investment. Whether you need a single SAP SD consultant or an entire team of SAP experts, we can provide them. Please our book a meeting service to get started.