Shopify Data, Analytics & ROI Series
- Boost Business with Key Shopify Analytics Insights
- Boost Ecommerce Success with Proven Customer Retention Tactics
- Mastering Abandoned Carts: Boost Your Shopify Store's Sales
- Reclaiming Sales: Abandoned Cart Recovery Strategies
- Optimizing Shopify: Proven Shopify Conversion Tips
- Maximizing Profits: E-commerce ROI Strategies for Shopify Success
Introduction
Running an online store without tracking your numbers is like driving blindfolded. You are moving forward, but you have no idea where you are going or what is actually working. That is where Shopify analytics comes in.
I have spent over a decade helping businesses turn data into actionable growth strategies. What I have learned is that most store owners sit on a goldmine of information and never use it.
They log into their dashboard, glance at total sales, and call it a day. That approach leaves significant money on the table. The truth is that Shopify analytics can transform how you run your business.
When you know what to track and how to interpret it, you make smarter decisions that drive real results. This blog post will help you start exploring the data that matters most.
Let me show you exactly how to use these tools to grow your store.
What Makes Shopify Analytics Different
- What Makes Shopify Analytics Different
- Core Metrics Every Store Owner Should Track
- Using the Overview Dashboard for Quick Insights
- Diving Deeper with Detailed Reports
- Live View: Real-Time Store Activity
- Product Analytics for Inventory Management
- Understanding Traffic Sources and Customer Behavior
- Testing and Refining Your Strategies
- Advanced Features for Growing Stores
- Common Mistakes to Avoid
- Maximizing Holiday Performance with Analytics
- Conclusion
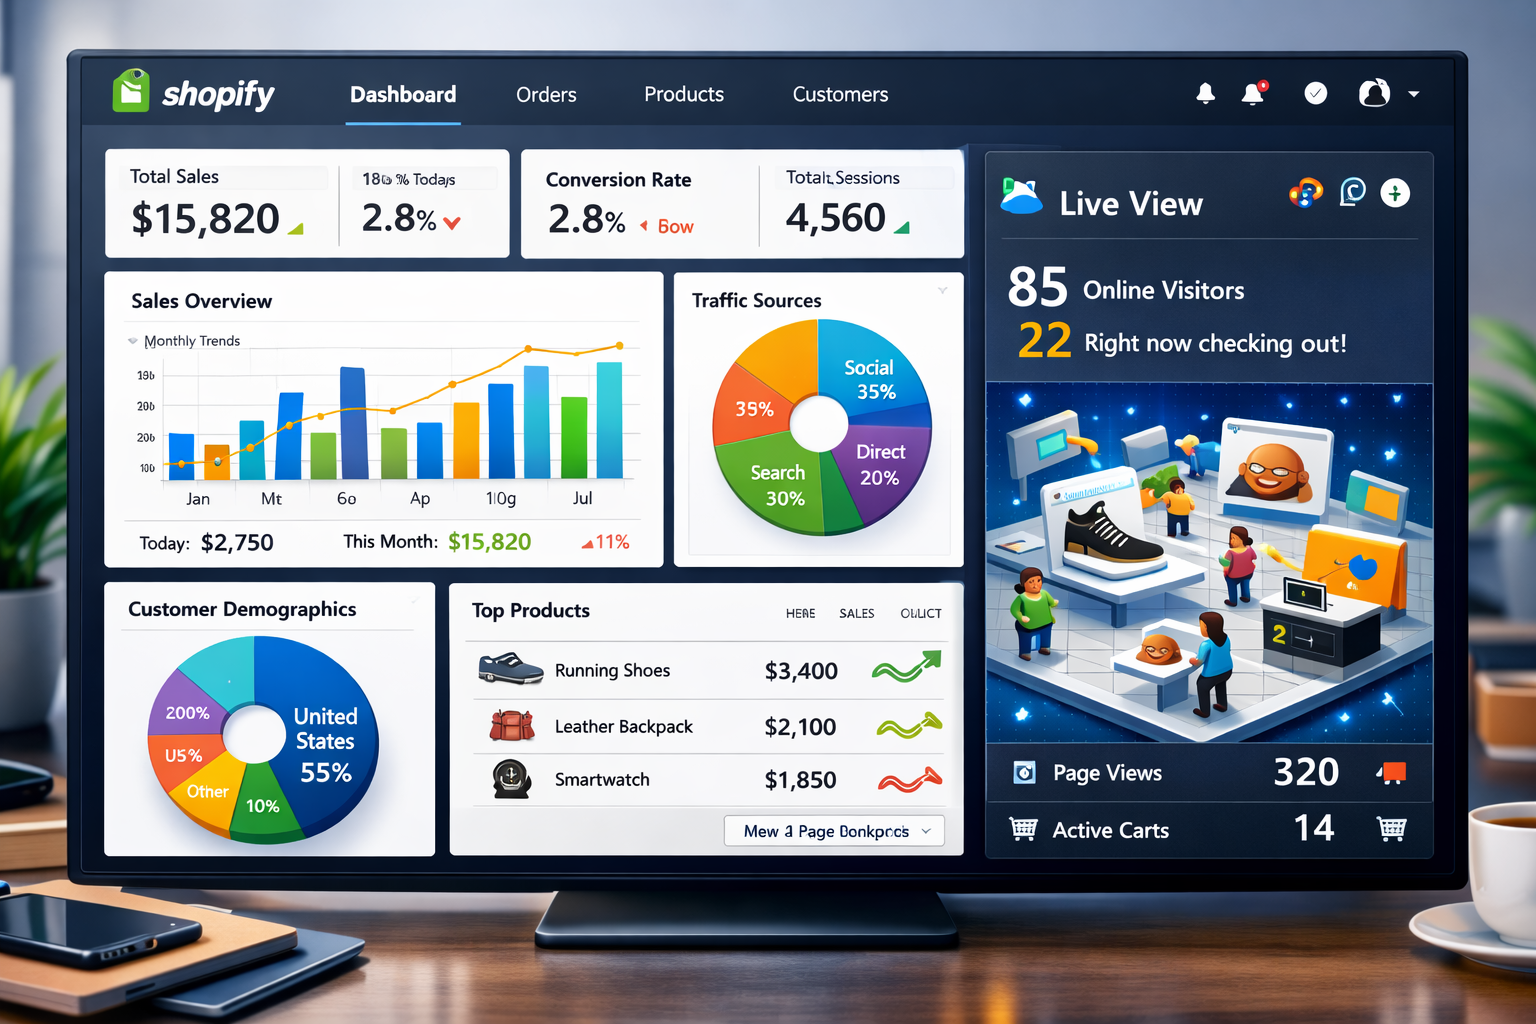
What Makes Shopify Analytics Different
Shopify's built-in reporting system gives you real-time insights into every corner of your business. Sales, traffic, and customer behavior all live in one central dashboard. This makes data analysis much more accessible than disparate systems.
Unlike third-party tools that take hours to set up, Shopify's analytics works the moment you launch your store. There is no coding required. You do not have to worry about complicated integrations or technical hurdles.
The system tracks key metrics that actually matter for your bottom line. You can see total sales, conversion rates, and where your visitors come from immediately. All of this updates in real time to keep you informed.
What really sets it apart is the Live View feature. This shows you who is on your site right now and what they are looking at. You can even see if they are about to buy.
Watching sales performance happen in real time feels incredible. But more than that, it helps you understand peak traffic times and behavior patterns. It connects you directly to the heartbeat of your online store.
For store owners on higher-tier plans, the customization options get even better. You can filter reports, use custom reports, and compare different data sets to find hidden opportunities. The analytics features scale with your business needs.
The dashboard organizes everything so you are not drowning in spreadsheets. One glance tells you if you are having a good day or if something needs attention. This clarity is vital for maintaining good business performance.
This accessibility matters because quick insights lead to faster decisions. When I work with clients, we often spot issues and fix them within hours because the data is right there. It empowers Shopify merchants to act swiftly.
Core Metrics Every Store Owner Should Track
Not all metrics deserve your attention. Some numbers look impressive but do not actually move your business forward. You need to identify the specific areas that drive growth.
Focus on these core metrics first. Total sales and net sales tell you how much revenue you are generating. However, net sales matter more because they account for returns and refunds.
Gross sales might make you feel good, but net sales show what you actually keep. Track both, but make decisions based on net. This protects your financial health.
Your conversion rate reveals how well your store turns visitors into buyers. If 100 people visit and two buy, that is a 2% conversion rate. Monitoring this helps you gauge the effectiveness of your site design.
Most Shopify stores see conversion rates between 1% and 3%. Anything above that means you are doing something right. Improving your store conversion is often cheaper than buying more traffic.
Average order value shows how much customers spend per transaction. Increasing this by even a few dollars can dramatically boost revenue without needing more traffic. It is a lever for immediate growth.
Traffic sources tell you where visitors come from. Social media, search engines, direct visits, or paid ads all bring different types of customers. Understanding this helps you allocate your budget.
Knowing which channels work best helps you invest time and money more wisely. I have seen stores waste thousands on ads that brought traffic but zero sales. Acquisition reports clarify where your best leads originate.
The returning customer rate measures loyalty. New customers are great, but repeat purchases cost less to acquire and spend more over time. This metric indicates long-term viability.
If your returning customer rate is low, your retention strategy needs work. Simple changes like email follow-ups can make a huge difference. Focus on turning one-time buyers into returning customers.
Session data shows how long people stay on your site and how many pages they visit. Short sessions with few page views usually mean something is wrong. It could be technical or content-related.
Maybe your site loads too slowly. Maybe your product descriptions do not answer questions. The data points to where you need to improve to keep store visitors engaged.
Using the Overview Dashboard for Quick Insights
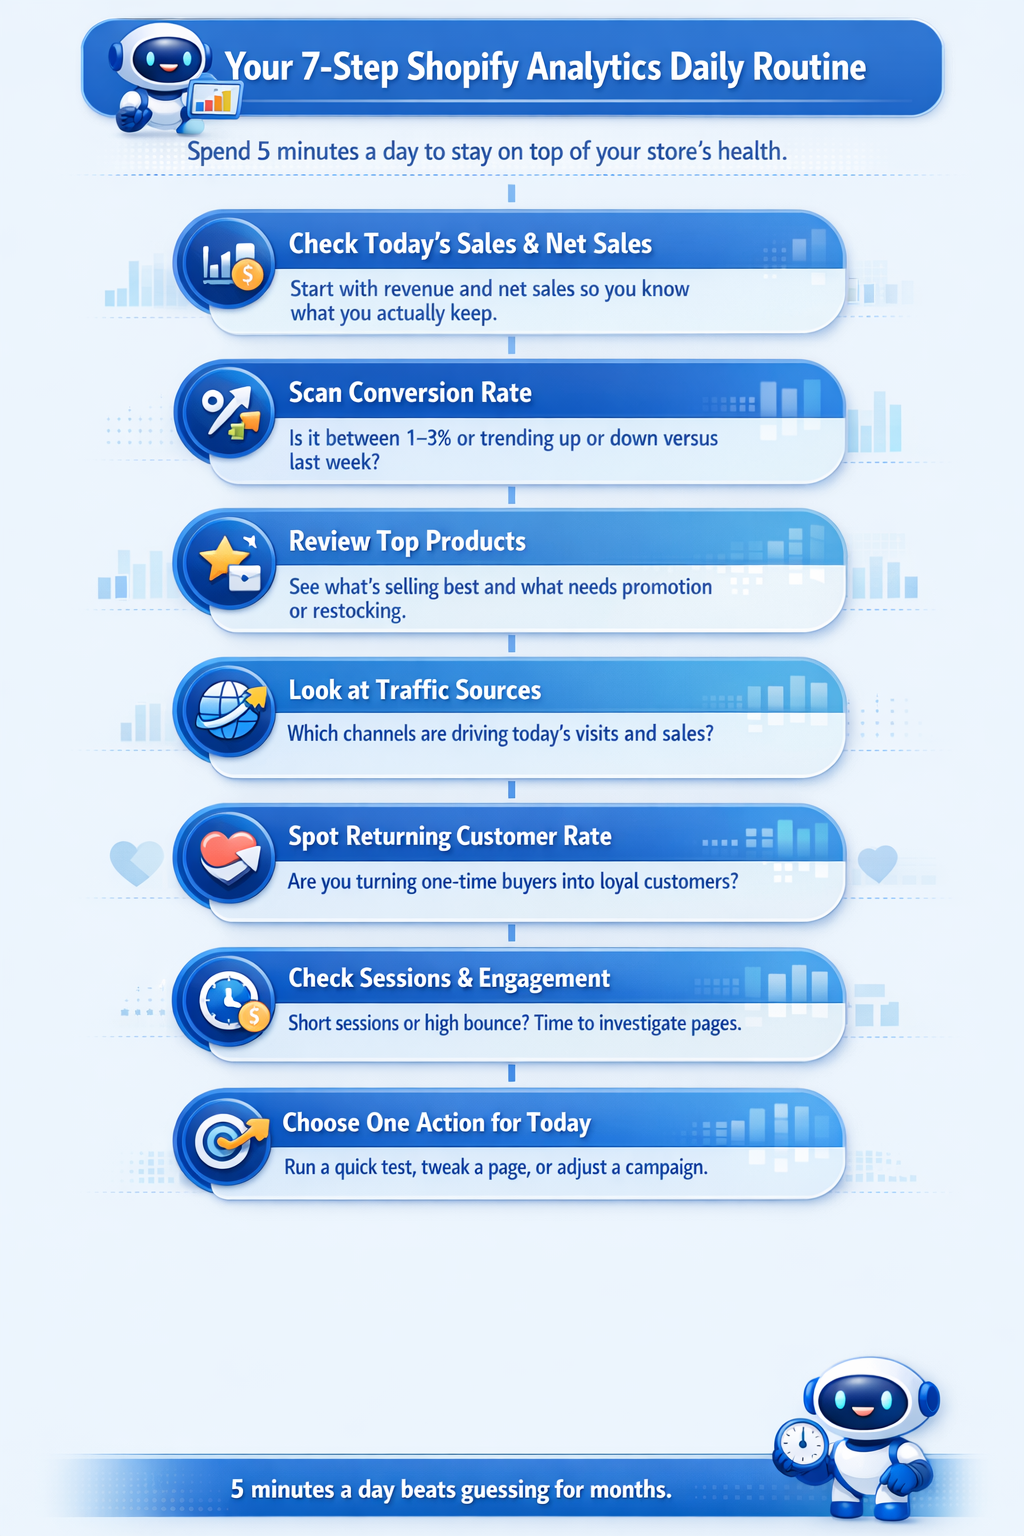
The Overview Dashboard is your command center. It displays the metrics that matter most in one convenient location. This is your starting point for daily analytics reporting.
You can customize what shows up here based on your goals. Want to focus on sales? Pin those reports front and center so they are always visible.
I check this dashboard every morning. It takes about 30 seconds to see if anything unusual happened overnight. This habit keeps you connected to your store performance.
The visual layout makes patterns obvious. You will spot trends, dips, and spikes without digging through spreadsheets. It provides a comprehensive analytics overview at a glance.
One of my favorite features is comparing date ranges. You can see this week versus last week, or this month versus last year. This time period comparison is essential for context.
These data comparisons reveal seasonality and show whether your growth efforts are working. If sales dropped 20% this week compared to last, you need to investigate. You cannot fix what you do not track.
The dashboard also highlights your top-performing products. Knowing what sells best helps you decide what to promote and what to reorder. It informs your broader inventory management strategy.
For many store owners, understanding Shopify analytics reports starts with spending just five minutes a day on this dashboard. Consistency is more important than depth in the beginning.
That small habit builds data literacy over time. You start recognizing patterns and understanding what different metrics mean for your business. It allows you to start exploring more complex data later.
Diving Deeper with Detailed Reports
The Overview Dashboard gives you the headlines. Detailed reports tell you the full story. To get deeper insights, you must look at the specific breakdowns.
Shopify offers over 60 reports covering sales, customers, finances, and inventory. Each one answers specific questions about your business. The variety of analytics offers allows for comprehensive analysis.
Sales reports break down revenue by product, channel, and time period. You can see which products drive the most sales and which ones sit on shelves. This helps in refining your catalog.
This information guides purchasing decisions. If a product variant barely sells, stop reordering it. Focus your capital on winners instead.
Customer reports show who is buying from you. You will see new versus returning customers, geographic locations, and customer lifetime value. This helps you analyze customer demographics effectively.
Understanding your customer base helps you tailor marketing messages. If most buyers come from one region, you might adjust shipping offers or ad targeting. You can build a profile of your ideal client.
Traffic reports reveal where visitors come from and how they behave on your site. You can track landing pages, referral sources, and search terms. These behavior reports are crucial for UX improvements.
This data shows which marketing channels actually work. I have helped clients cut ad budgets in half by focusing only on channels that convert. This optimizes your marketing campaign spend.
Financial reports give you a clear picture of costs and profits. You will see payment processing fees, shipping costs, and net revenue after expenses. Tracking your profit margin is essential for survival.
These numbers matter when planning budgets and setting prices. Many store owners price too low because they do not account for all costs. Accurate reports shopify provides prevent this mistake.
Inventory reports track stock levels, sell-through rates, and days of inventory remaining. Running out of popular products costs you sales. You need to keep a close eye on these figures.
The ABC analysis feature identifies which products generate the most revenue so you can prioritize inventory accordingly. This ensures your capital is tied up in the right stock.
| Report Type | Key Insight | Why It Matters |
|---|---|---|
| Acquisition Reports | Traffic Source | Identifies where your visitors are coming from (e.g., social, search). |
| Sales Reports | Sales by Product | Shows which items are your best sellers and which are dead weight. |
| Behavior Reports | Online Store Conversion | Tracks the percentage of visitors who complete a purchase. |
| Inventory Reports | ABC Analysis | Prioritizes stock based on revenue contribution. |
Making Data Driven Decisions
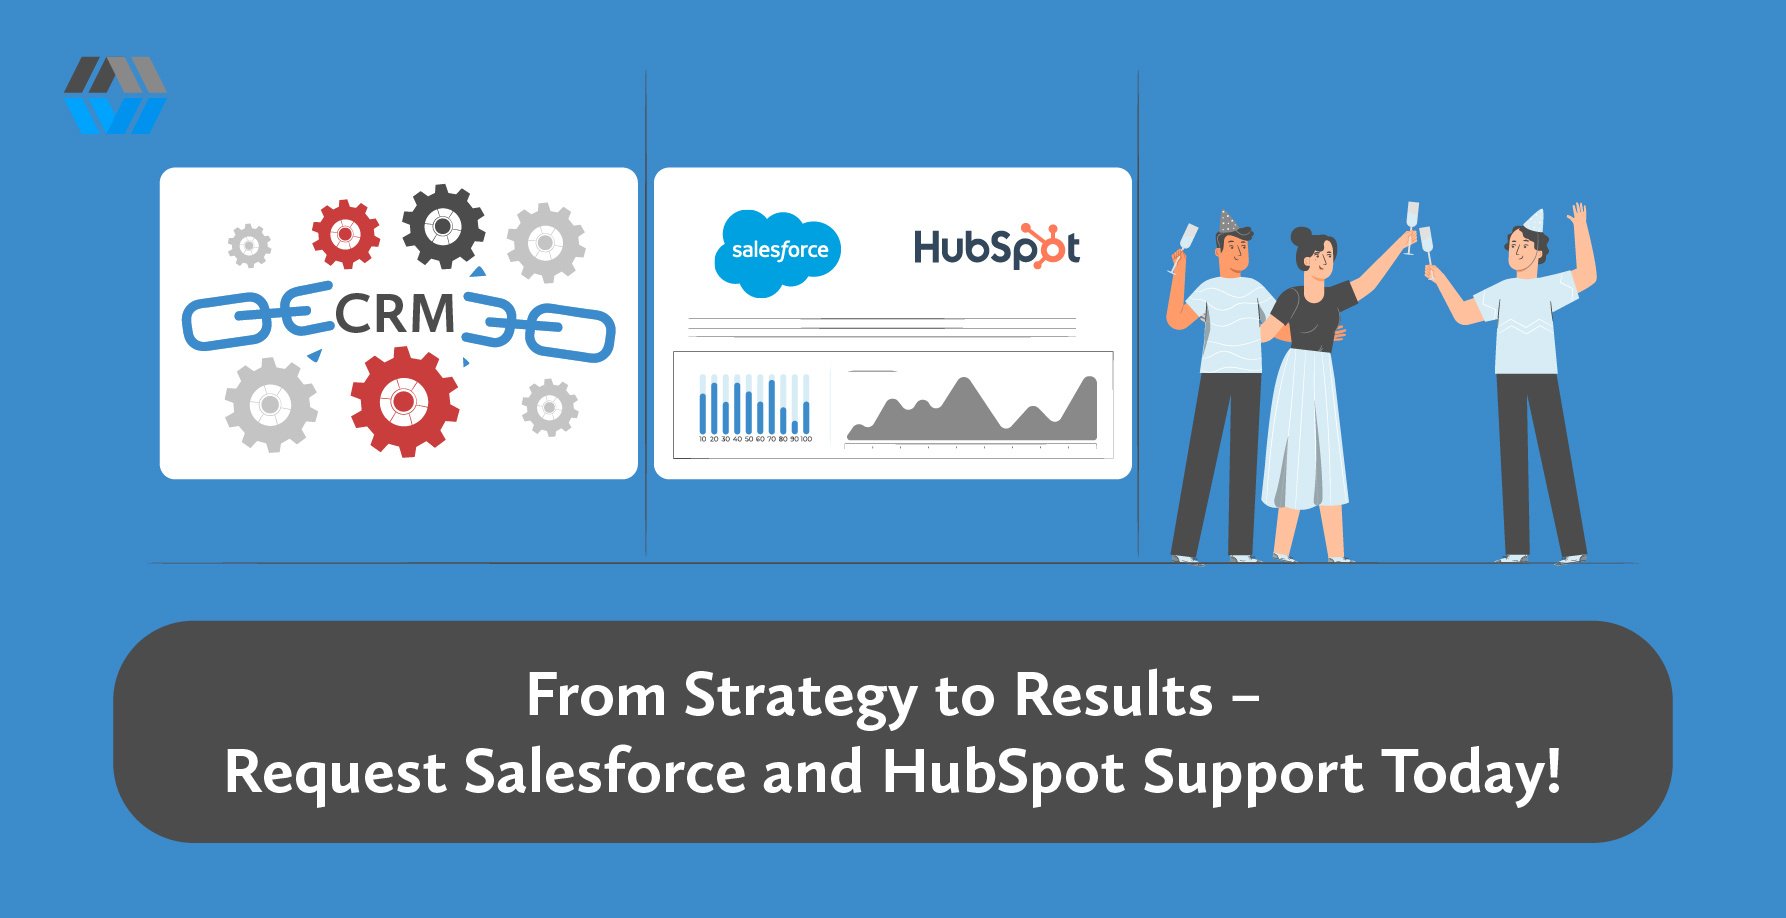
For a real‑world example of what disciplined analytics can do, see how a global footwear brand used Shopify and HubSpot data to scale revenue.
Live View: Real-Time Store Activity
Live View is one of the most exciting features in Shopify analytics. It shows you exactly what is happening on your store right now. It provides a pulse on your business.
You can see how many people are browsing, what pages they are on, and whether anyone just placed an order. It updates every few seconds. This real-time data is addictive to watch.
A geographic map displays where visitors are located. This helps you understand your market reach and identify new opportunities. You might find traffic coming from unexpected places.
The feature also shows active carts, which tells you how many people are about to buy. If you see carts but no completed orders, something might be wrong with checkout. It acts as an early warning system.
I use Live View during product launches and sales events. Watching traffic surge and orders come in validates that marketing efforts are working. It gives you immediate feedback.
It also helps you spot technical issues immediately. If traffic drops to zero during business hours, you know something is broken. Quick detection saves lost revenue.
For stores with physical locations or events, Live View reveals traffic patterns. You can see when people are most active and adjust staffing or promotions. It connects the online and offline worlds.
The data covers the last 60 minutes, giving you a short-term window into store performance. It is not meant for long-term analysis but for immediate awareness. It complements your historical shopify reports.
This real-time visibility creates a connection to your business that spreadsheets never could. You are watching your store breathe and respond to customers. It brings the data to life.
Product Analytics for Inventory Management
Managing inventory without data is guesswork. You either run out of bestsellers or get stuck with products nobody wants. Shopify offers tools to mitigate this risk.
Shopify's product analytics solve this problem with sell-through rates and inventory forecasting. These metrics tell you how fast products move. They help you maintain the right balance.
Sell-through rate measures the percentage of inventory sold during a specific period. A high rate means products fly off shelves. It indicates strong demand.
Low rates indicate slow movers that tie up cash. You might need to discount these items or stop reordering them entirely. This frees up budget for better items.
Days of inventory remaining shows how long current stock will last based on recent sales velocity. This prevents stockouts and overordering. It is a critical metric for inventory management.
If a popular product has only five days of inventory left, you need to reorder immediately. Waiting too long costs you sales. Being proactive is key.
The ABC analysis categorizes products by revenue contribution. A-products generate the most revenue, B-products are mid-tier, and C-products contribute the least. This simplifies prioritization.
Focus your attention on A-products. Make sure these never go out of stock and consider promoting them more heavily. They are the engine of your store sales.
Product analytics also reveal hidden opportunities. Sometimes a low-priced item sells in huge volumes and generates significant total revenue. This is known as a volume driver.
Understanding these patterns helps you optimize your product mix. You can phase out underperformers and double down on winners. It refines your entire catalog strategy.
For stores managing multiple warehouses or fulfillment centers, these insights help allocate inventory efficiently. Send popular products where they sell fastest. This reduces shipping times and costs.
Understanding Traffic Sources and Customer Behavior
Knowing where traffic comes from changes how you market your store. Different sources bring different types of customers. Your analytics reporting should focus heavily here.
Social media traffic might browse a lot but convert less. Search engine traffic often has higher intent and better conversion rates. You need to treat them differently.
Shopify analytics breaks down traffic by source so you can see which channels drive the most visits and sales. This information guides where you invest time and money. It helps you calculate ROI.
I have worked with stores that spent heavily on Instagram ads only to discover most sales came from Google searches. Reallocating the budget doubled their revenue. This is the power of data analysis.
Landing page performance shows which pages people visit first and whether they stick around. If most visitors land on your homepage and immediately leave, the page needs work. High bounce rates kill conversions.
Customer behavior data reveals how people navigate your site. You can see common paths through your store and where people drop off. This highlights friction points.
If everyone visits a product page but nobody adds to cart, the product description might be unclear. Or the price could be too high. You need to investigate the barrier.
Session duration and page views per session indicate engagement. Longer sessions with more pages usually mean higher interest. It suggests your content is resonating.
But context matters. A quick session ending in a purchase is better than a long session with no conversion. You want efficiency, not just loitering.
Analyzing customer behavior through Shopify analytics offers helps you optimize the entire shopping experience from first click to checkout. It is about smoothing the path to purchase.
Testing and Refining Your Strategies
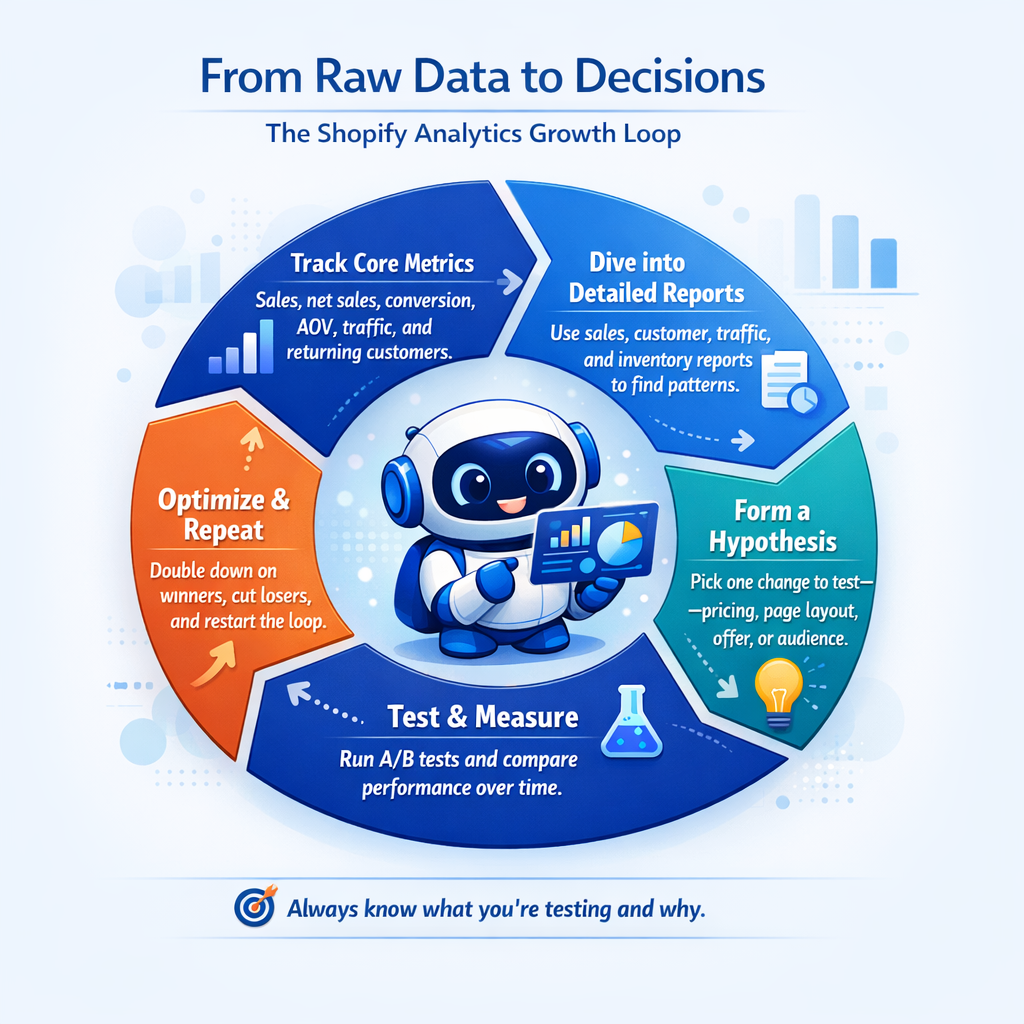
Data tells you what is happening. Testing tells you how to make it better. You must constantly analyze performance to grow.
A/B testing lets you compare different versions of headlines, calls to action, and page layouts to see what converts best. It removes the guesswork from design.
Change one element at a time so you know what caused any difference in results. Testing multiple changes simultaneously makes interpretation impossible. Isolate your variables.
Start with high-impact areas like product pages and checkout. Small improvements here often generate significant revenue gains. Even a fractional increase helps.
For example, testing different product image layouts might increase conversions by 10%. On a store doing $50,000 monthly, that is an extra $5,000. The ROI on testing is massive.
Use Shopify analytics to measure test results. Track conversion rates, average order value, and revenue for each variation. Let the data decide the winner.
Run tests long enough to gather meaningful data. A few days rarely tells the full story. Aim for at least a week or a few hundred visits per variation.
Beyond formal testing, regularly review your analytics to spot opportunities. If traffic from Facebook drops, investigate whether your posting frequency changed. Look for correlations.
When conversion rates dip, look for recent changes to your site. Maybe a new app slowed page loads. Or a price increase turned buyers away.
The key is treating your store as an ongoing experiment. Test, measure, adjust, and repeat. Over time, these small improvements compound into major growth.
Advanced Features for Growing Stores
Basic Shopify analytics work great for new stores. But as you grow, you will want more powerful features. The Shopify plan you choose dictates some of this access.
Higher-tier plans unlock advanced reporting and custom filtering. You can segment data in ways that reveal deeper insights. This is crucial for scaling.
For example, you might filter sales reports to show only orders over $100 from returning customers in California. This specificity helps you understand niche segments. It allows for hyper-targeted marketing.
Custom reports let you focus on the exact metrics that matter to your business. Instead of scrolling through standard reports, you see only what you need. This saves time and reduces noise.
The Reports API available on Shopify Advanced and Plus plans takes things even further. It opens up a world of possibilities for developers.
This lets developers pull data directly from your store and integrate it with other systems. You can build custom dashboards or combine Shopify data with other sources. This is often necessary for enterprise brands.
Queries are written in ShopifyQL, a specialized language for working with Shopify data. It is powerful but requires technical knowledge. It allows for extremely granular analysis.
Many growing stores also integrate third-party analytics tools. Google Analytics, for instance, offers different tracking capabilities and attribution models. It works alongside Shopify's tools.
Apps from the Shopify App Store extend analytics functionality even further. Some specialize in cohort analysis, others in profit tracking. There is an app for almost every specific need.
The right tools depend on your specific needs. If you are managing multiple stores or sales channels, a unified dashboard that combines all data saves massive time. Creating custom dashboards becomes a priority.
For stores doing high volume, profit analytics become critical. Revenue looks great, but what is left after costs? Apps that track true profitability prevent nasty surprises.
You can also access your data through the API and build completely custom solutions. This flexibility supports unique business requirements. Shopify Editions often announce updates to these capabilities.
Common Mistakes to Avoid
Most store owners make predictable mistakes when using Shopify analytics. Avoiding these saves time and prevents bad decisions. Awareness is the first step.
First, do not obsess over vanity metrics. Total page views look impressive but do not pay bills. Focus on metrics tied to revenue and the total number of orders.
Second, avoid making decisions based on small data samples. One slow day does not mean your business is failing. Look at sales trends over weeks or months.
Third, do not ignore metrics that tell uncomfortable truths. If your return rate is high, ignoring it will not help. Dig into why and fix the problem.
Fourth, remember that correlation does not equal causation. Traffic might spike when you post on Instagram, but that does not prove Instagram caused the spike. Dig deeper into your acquisition reports.
Fifth, do not forget to track changes you make. If you adjust pricing or launch a new ad campaign, note it so you can measure impact. Context is everything in analysis.
Sixth, avoid setting up reports and never reviewing them. Data only helps if you actually look at it and act on insights. Make reviewing marketing reports a weekly habit.
Seventh, do not expect analytics to solve everything. Data guides decisions, but you still need creativity and intuition to grow your business. Use data to support your vision, not replace it.
Maximizing Holiday Performance with Analytics
Holiday seasons make or break many online stores. Using Shopify analytics during these periods is critical. The Black Friday Cyber Monday period is the ultimate test.
Tracking holiday performance starts weeks before the actual event. Review last year's data to predict traffic patterns and stock needs. Historical data is your best predictor.
Monitor inventory levels closely as the holiday approaches. Running out of bestsellers during peak shopping days is devastating. You want to capture every sale possible during Black Friday.
Use Live View during major sales events like Cyber Monday. This lets you catch technical issues immediately before they cost too many sales. Every minute of downtime hurts.
You should also set up specific marketing campaigns for the Friday Cyber weekend. Track these separately to see which offers perform best. This helps you pivot quickly if a promotion is flopping.
During the Black Friday Cyber rush, your store conversion rates should spike. If they don't, check your pricing and checkout flow. High traffic with low conversion indicates a problem.
After the dust settles on Black Friday Cyber Monday, do a deep post-mortem analysis. Look at what worked, what failed, and where you lost customers. This prepares you for next year.
Remember to update your privacy policy if you are collecting new types of data during these events. Compliance is just as important as revenue.
Frequently Asked Questions
Is Shopify analytics free?
Yes, free analytics are included with every Shopify plan. However, advanced reports are reserved for higher tiers. The basic analytics offers are sufficient for most new stores.
Can I use Google Analytics with Shopify?
Absolutely. Most Shopify merchants use both. Google Analytics provides deeper traffic insights, while Shopify handles sales data better. They complement each other well.
How do I create a custom report?
To start creating custom reports, navigate to the Analytics section in your dashboard. You can filter and save specific views. This is available on the Shopify/Advanced plans.
Where can I learn more?
The Shopify Academy is a great resource. They offer courses on how to read and use your data. It is a good place to start your education.
Conclusion
Shopify analytics is more than just a dashboard of numbers. It is a roadmap for your business. It tells you where you have been and guides where you should go next.
By focusing on the right metrics and using detailed reports, you can stop guessing and start growing. The data is there, waiting for you to use it.
Don't be intimidated by the charts and graphs. Start with the basics, track your core metrics, and gradually explore the more advanced features. Start exploring your data today.
If you want to turn these numbers into a roadmap, follow the Shopify Mastery framework to build a data‑driven growth plan.
Whether you are preparing for Black Friday Cyber Monday or just managing daily sales, these tools are essential. They turn your store sales data into a competitive advantage.
Open your Shopify analytics dashboard now. Look at your conversion rate. Check your top products. Then, take action. The best time to become data-driven is right now. If you’re short on time or internal expertise, you can work with a Shopify consulting expert who builds and interprets these analytics for you.
Next in the Shopify Data, Analytics & ROI Series:
About Us
As a certified Shopify Partner with deep, hands-on ecommerce experience, we help companies turn strategy into predictable, measurable revenue growth. When you’re ready to move from planning to execution, this guide walks through proven Shopify marketing and promotion strategies to increase sales.
We are also a HubSpot Certified Inbound Marketing Agency and HubSpot Certified Sales Agency, uniting proven demand generation with disciplined, structured sales execution. As an official Google Partner, our Google Ads management ensures your paid acquisition is tightly aligned with ROI and profitability targets.
From large, complex SAP environments to small and mid-sized businesses across industries—including legal practices, public figures and celebrities, consumer packaged goods, apparel and fashion brands, and manufacturing—we bring enterprise-grade rigor, data-driven precision, and accountable execution to every engagement.
