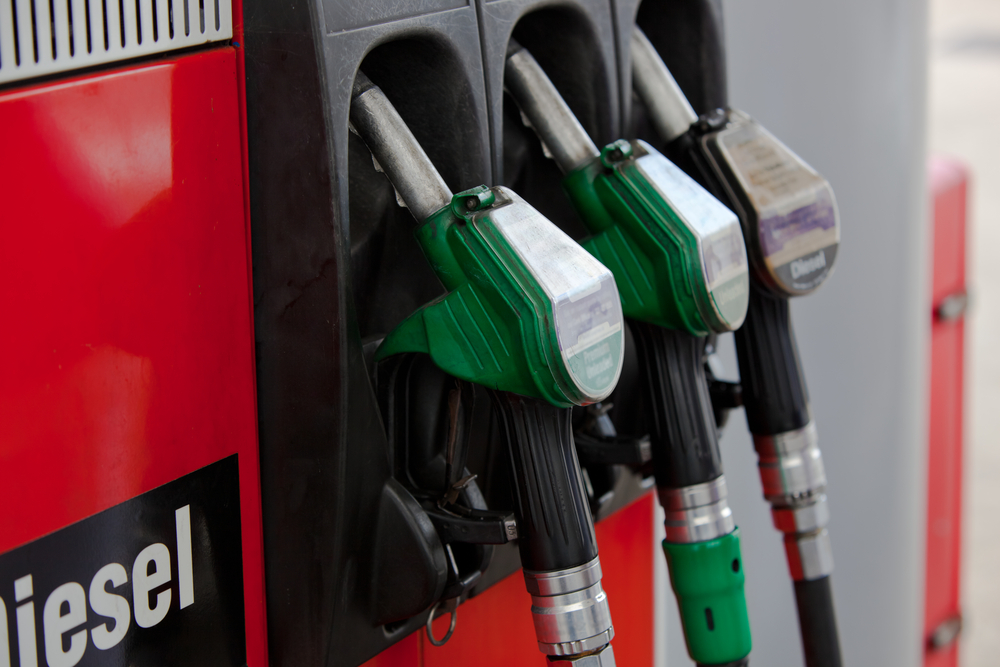
Like most people, I’ve been feeling the pain at the pump. With yet another upcoming trip to see my aging mom, I wondered what is going on. Is it high oil prices, an imbalance between supply and demand or perhaps, an issue with the refineries.
Being data oriented, I decided to do a little digging on the U.S Energy Information Administration website to see what insight might be buried there.
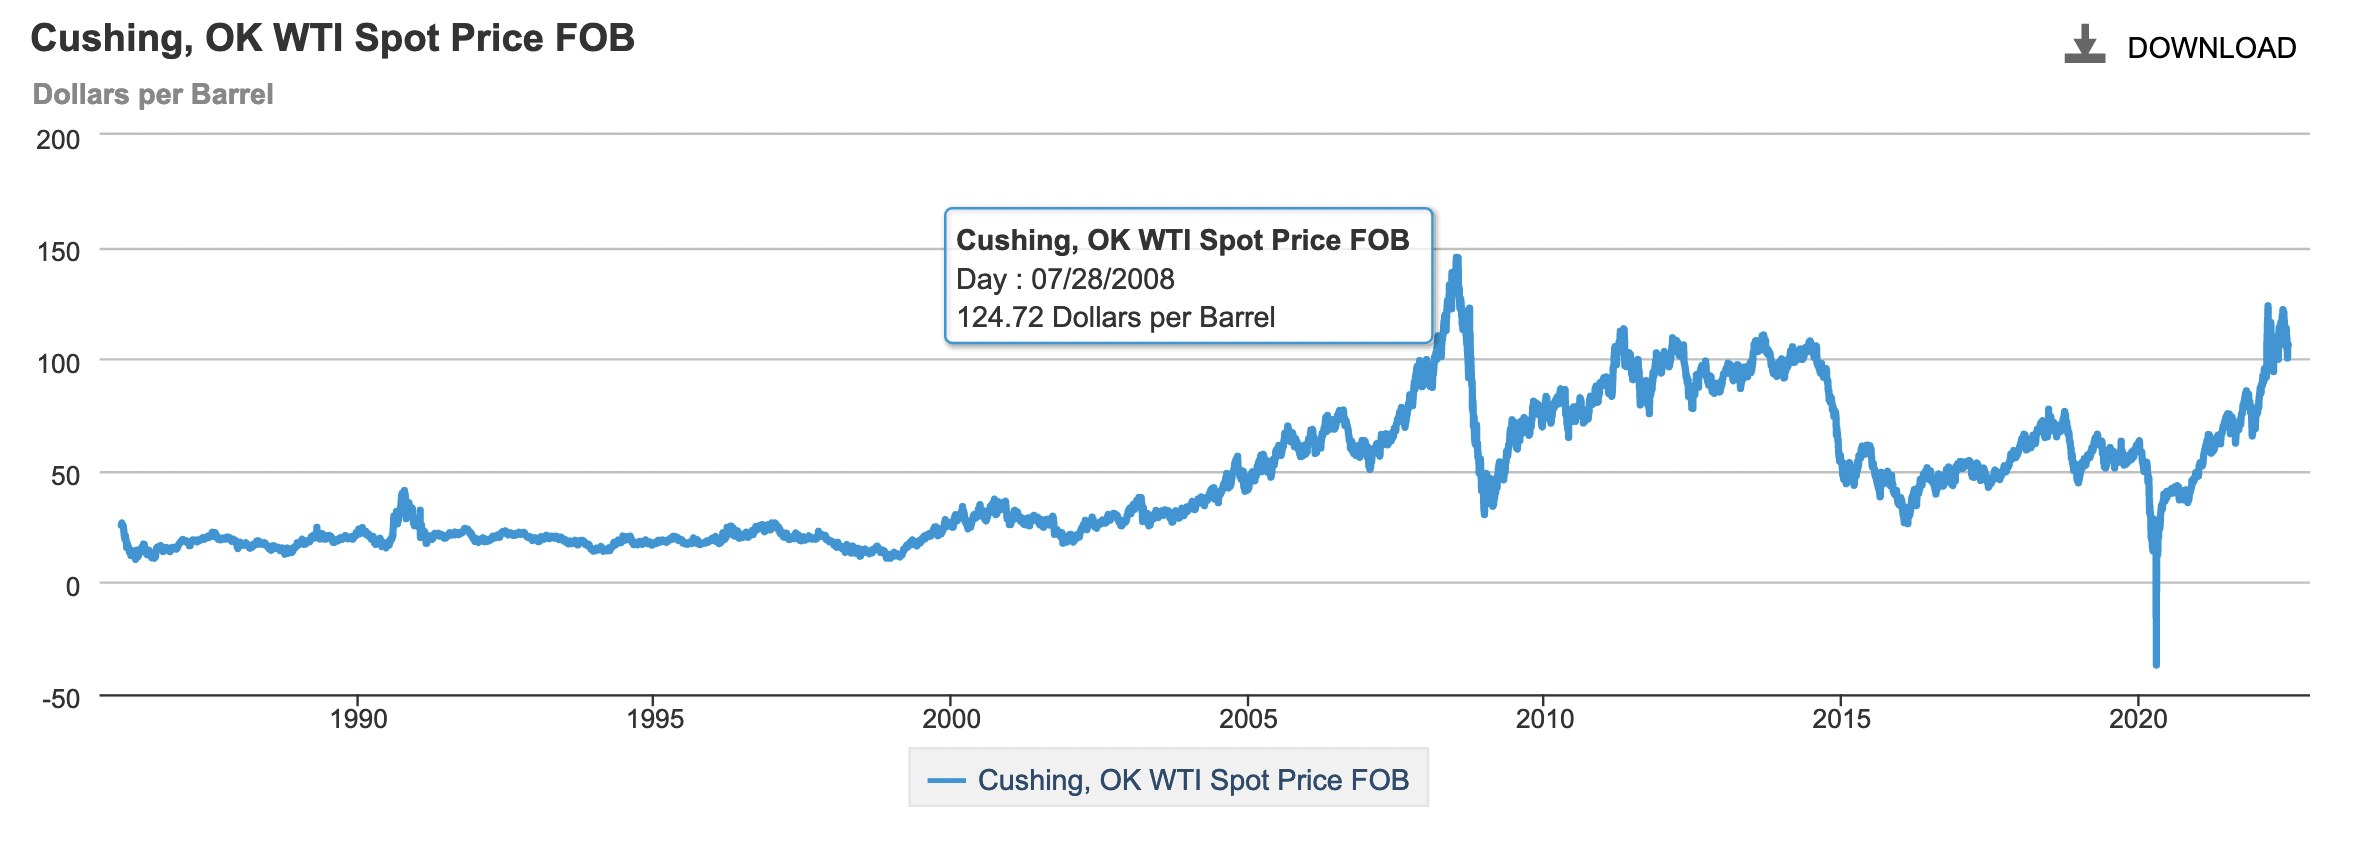
Oil Prices – High But Not at Record Levels
Though high, about $110 today +- $5 dollars a barrel lately, it’s still well below the peak of $124. 72 reported in 2008. There doesn’t appear to be any shortage of oil production as well, at least not in the U.S.
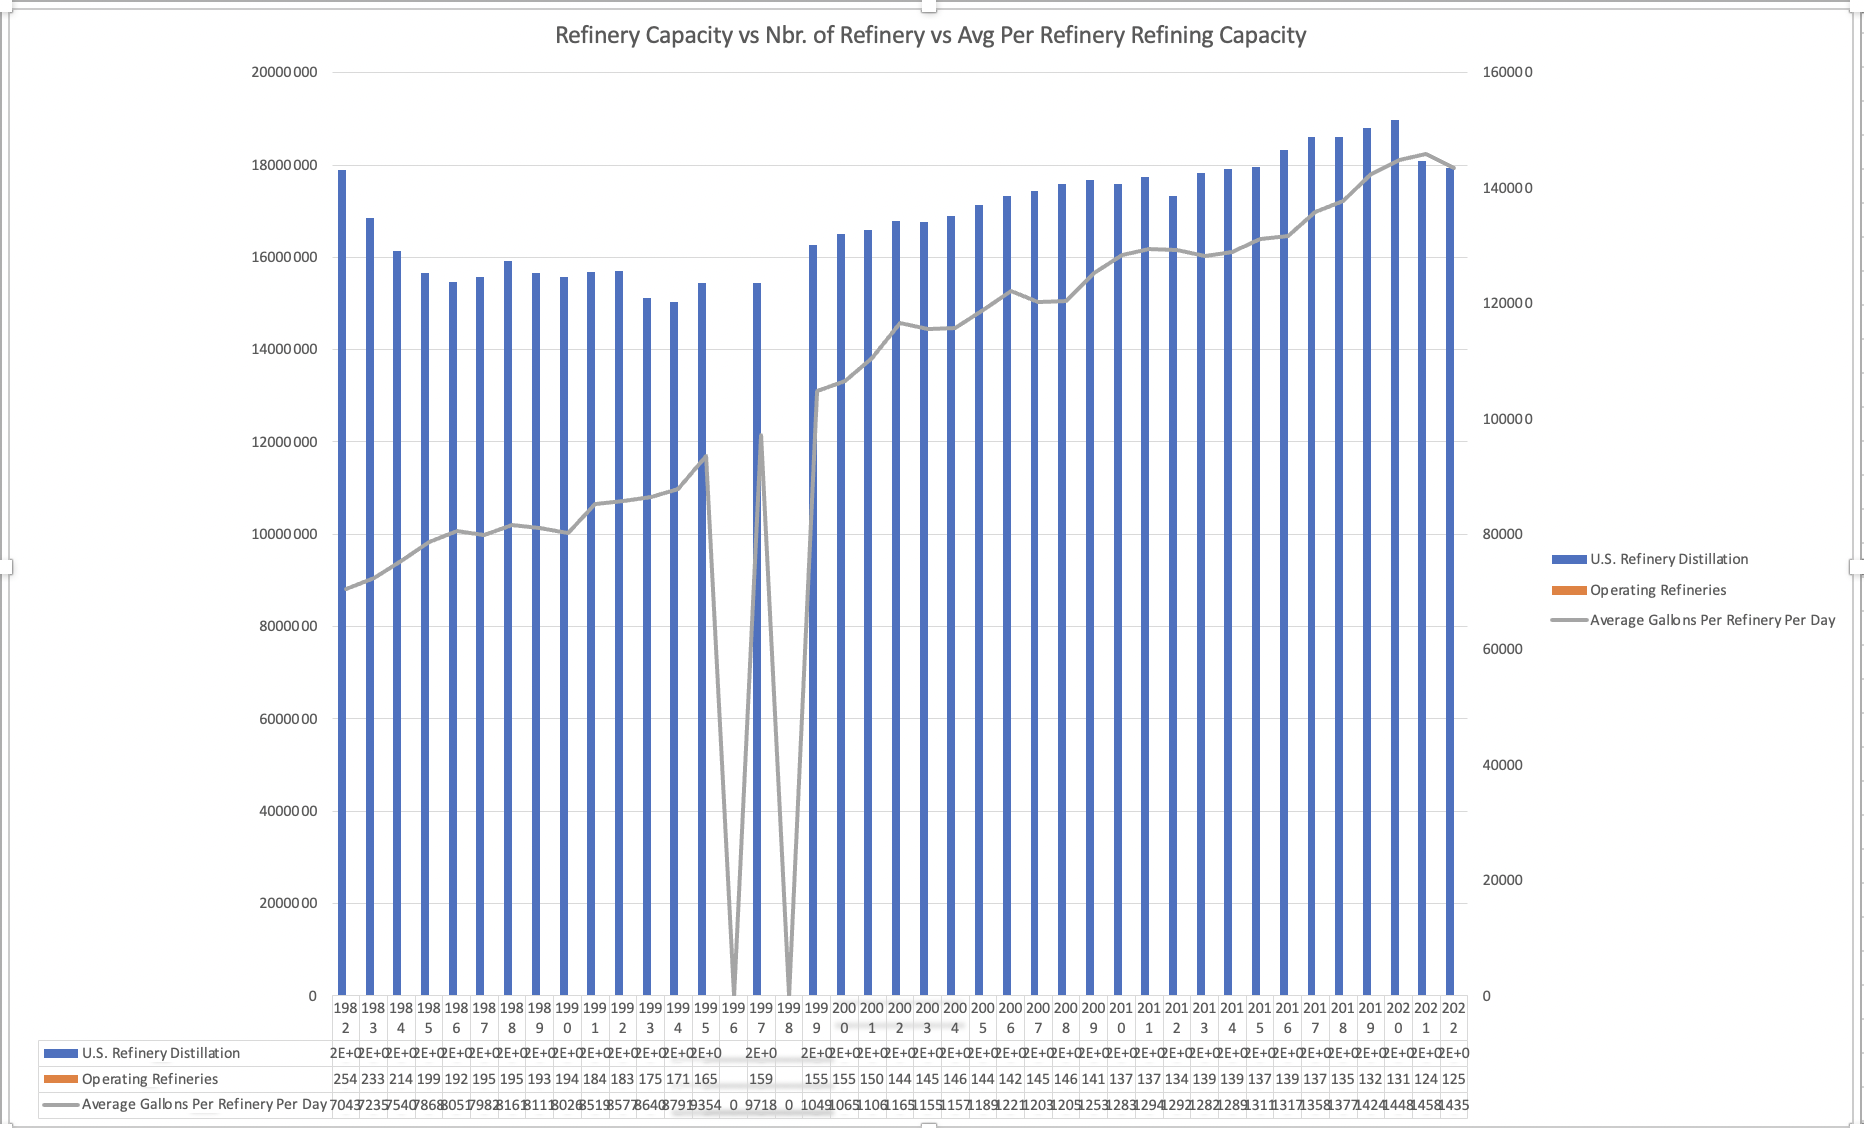
Refinery Productivity – Something Broke
This is the chart that tells the story I was looking for. May not be perfect. But what it says is that though the absolute number of refineries has dropped by about 50% since 1982, the limit of the available data provided by the EIA, the actual daily production rate of the refineries appears to have steadily increased, more than enough to meet demand, at least until 2021. Gross domestic product has steadily increased at the same time. My background in SAP ERP sales to refineries tells me this was made possible by the every day process improvements made to production process. There dramatic differences in measured refinery productivity, often within the same company.
Somebody Touched Something
Starting in 2021 and continuing to this day, even though no new refineries have been built in a very long time, it is clear that something broke. Labor productivity continued to steadily improve across the same time frame. Over the long term, one would expect refinery productivity to have improved at more or less the same rate.
Refinery Maintenance is Normal
There are always shutdowns for planned maintenance on complex equipment. That’s just the nature of operating a refinery. And from experience, I can tell you there are vast differences in refinery productivity, but that all of them seem to have been improving at a rate sufficient to meet U.S. gasoline demand.
Questions This Chart Raises
What happened in the 1980s?
Based upon the data in the chart, it is clear that refinery production took a sudden, steep, sustained decline that started in 1982 and continued until 1999, at which point, production began to increase. The economy was doing ok back then, so no idea what caused the turn-around. I can say that business productivity continued to improve. Improved productivity typically results in higher output. Continuously improving productivity is, in fact, a key reason the U.S. economy blows all others out of the water, year in, year out. It's also why our well being actual improves as time moves along.
1999-2014 - Slow Refinery Production Increase
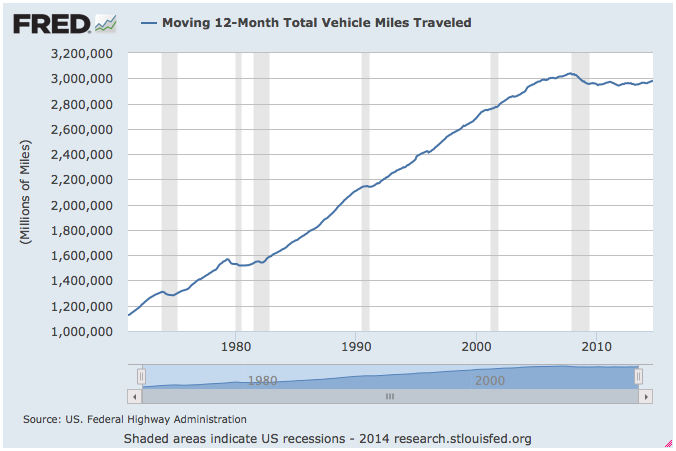
Though there were at least 2 recessions during this period of time, mostly, the economy appeared to expand and people steadily, if slowly, increased their miles driven. However, there were also substantial improvement in CAFE (Corporate Average Fuel Economy) figures, which might mean more miles were driven while using less fuel.
2016-2020- Faster Production Growth
This appears to be a fairly rapid growth spurt, coming out of the 2008 financial crisis, and driven by rapid economic growth. It also marked the beginning of the COVID lockdown. This has had dramatic impacts on living standards, with inflation for goods and services on a relentless rise, and looking like it will continue that way.
However, if you look at the miles driven chart, you can see the number of miles driven actually flat-lined. This also corresponds to the time where the U.S. lifted restrictions on exporting certain Petroleum Products. Unless we were exporting gasoline, then there was no reason for the increased refinery output, yet it happened.
Long Run Physical Capital Improvement
Another insight that jumps out at me is that these numbers do not match observations of mine made 'on the ground' of various oil refineries around the world. They are constantly implementing productivity measures that increase productivity.
Majors Track Productivity with a Microscope
Many refineries are actually part of a global web of refineries, owned by one of the oil majors. That means individual refinery productivity is measured relentlessly. They use systems like SAP to track productivity at both plant, region and company level. Their overarching goal is productivity growth. They typically track such things as total number of hours worked and of course, overall economic performance.
Low productivity plants are normally put on a process improvement plan. Employee labor hours are ALWAYS a focus of these improvement plans. Personal productivity is also measured, and plenty of help is given to help individuals improve or find alternative activities.
2021-2022 - Production Fell Off a Cliff
While COVID, which brought the world economy to a halt, definitely is reflected in these numbers, the economy actually came roaring back.
It would appear that someone touched something they shouldn't have.