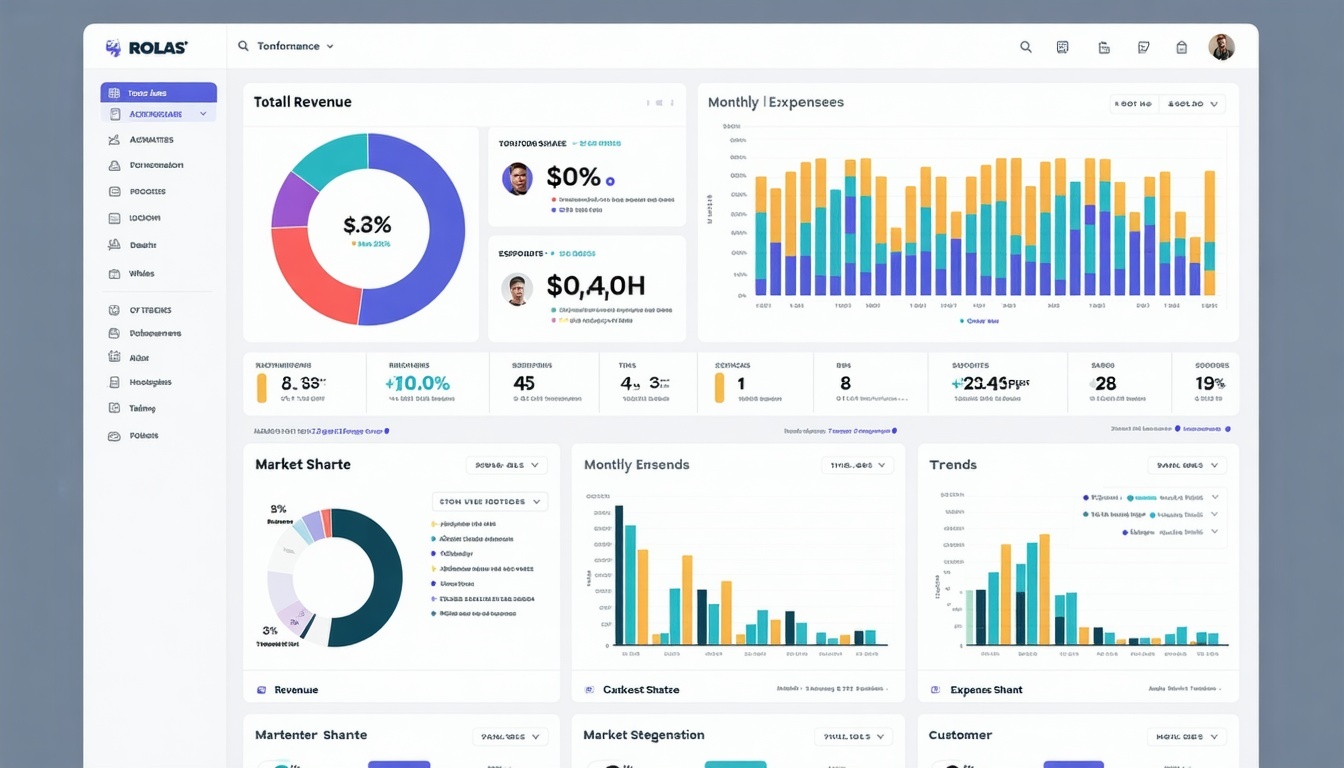
Unlock the full potential of your business data with executive dashboards that provide real-time, actionable insights.

Overcoming Data Overload: The Executive Challenge
In today's data-driven world, executives are bombarded with an overwhelming amount of information. Spreadsheets and reports pile up, but getting a straight answer about the business feels like an impossible task. This data overload makes it challenging to see the bigger picture, leading to frustration when critical decisions are on the line.
Executives need a streamlined way to distill vast amounts of data into meaningful insights. This is where executive dashboards come in. By visualizing key performance indicators (KPIs) and other crucial metrics, dashboards provide a clear, high-level view of the business, allowing leaders to make informed, strategic decisions quickly.
The Core Purpose: Defining Your Dashboard's Mission
Before diving into the design and implementation of an executive dashboard, it's essential to define its core purpose. What is the primary goal of the dashboard? Is it to monitor financial health, track marketing performance, or measure operational efficiency?
Understanding the "why" behind the dashboard is crucial. Sit down with the executives who will use it and ask them, "What are the top five questions you need answered every morning when you log in?" Their responses will form the foundation of the dashboard, ensuring it is tailored to their needs and adds real value.
For instance, a CEO might need an overview of revenue trends and cash flow, while a VP of Sales might focus on pipeline coverage and quota attainment. Without a clear purpose, a dashboard can become a cluttered collection of charts that offer little actionable insight.
Selecting the Right KPIs: Metrics That Matter
Once the dashboard's mission is defined, the next step is selecting the right KPIs. The temptation to include every available metric should be resisted. Instead, focus on a few meaningful KPIs that are directly tied to your business objectives.
A cluttered dashboard with dozens of metrics can be overwhelming and counterproductive. Instead, highlight metrics that truly reflect the business's health and direction. For example, an executive financial dashboard should focus on stability, profitability, and growth, with metrics like Gross Profit Margin, Operating Cash Flow, and Net Profit Margin.
Similarly, an IT executive dashboard should track infrastructure health, service delivery, and project performance, with metrics such as System Uptime, Mean Time to Resolution (MTTR) for incidents, and IT budget variance. By focusing on the right KPIs, you ensure the dashboard provides a clear pulse on the business.
Design Principles: Keeping Your Dashboard Clean and Simple
The design of the executive dashboard is just as important as the data it presents. A well-designed dashboard should be a quiet servant to the data, making information easy to digest in seconds. The most effective dashboards use a minimalist aesthetic, with plenty of white space to separate different elements and reduce cognitive load.
Limit the dashboard to five to seven main visuals on a single view. If more data needs to be displayed, create additional views or allow users to drill down for more details. The main screen should provide a simple, uncluttered summary, enabling executives to get answers quickly.
The layout should guide the user through a narrative, starting with the most important, high-level numbers at the top left and providing more context and detail as the eye moves down and to the right. This narrative structure transforms the dashboard from a static report into a dynamic decision-making tool.
Common Mistakes to Avoid When Building Dashboards
Even with the best intentions, it's easy to fall into common pitfalls when building an executive dashboard. Here are a few mistakes to watch out for:
- Information Overload: Avoid the temptation to include too many charts and numbers. Stick to the essential KPIs and give them room to breathe.
- Ignoring Data Quality: Your dashboard is only as good as the data feeding it. Ensure that your source data is accurate and clean.
- One-Size-Fits-All Approach: Different executives care about different things. Tailor the dashboard to its audience, and consider creating different versions for different roles.
- Slow Load Times: Executives have little patience for slow technology. Optimize queries and use data caching to improve performance.
- Creating and Forgetting: A business is always changing, and your dashboard should evolve with it. Review and update it regularly to ensure it remains relevant and useful.
How SAP BW Consulting Can Help: Turning Data into Insights
Creating an effective executive dashboard requires a blend of art and science. It involves understanding your audience, focusing on what matters, and presenting information clearly. This is where SAP BW Consulting, Inc. can make a significant difference.

SAP BW Consulting, Inc. specializes in unlocking the full value of enterprise data by delivering expert SAP Business Warehouse solutions, including executive dashboards that provide real-time, actionable insights.
Their services span Business Intelligence, Project Management, Financial and Controlling, and more, all designed to improve operational visibility and strategic decision-making.
Beyond SAP, they offer integrated Inbound Marketing and Sales consulting, digital advertising through Google Ads, eCommerce optimization via Shopify and Amazon, and seamless integration with SAP systems. Whether you're looking to understand performance metrics better, improve lead generation, or unify your digital stack, SAP BW Consulting provides the strategic insight and technical execution to make it happen.
By leveraging their expertise, you can transform raw data into powerful insights, driving your business forward with confidence and clarity.


